Doc# E145701 6 - 16
6: Using the Shark® 100 Meter
Electro Industries/GaugeTech
The Leader In Power Monitoring and Smart Grid Solutions
Electro Industries/GaugeTech
The Leader In Power Monitoring and Smart Grid Solutions
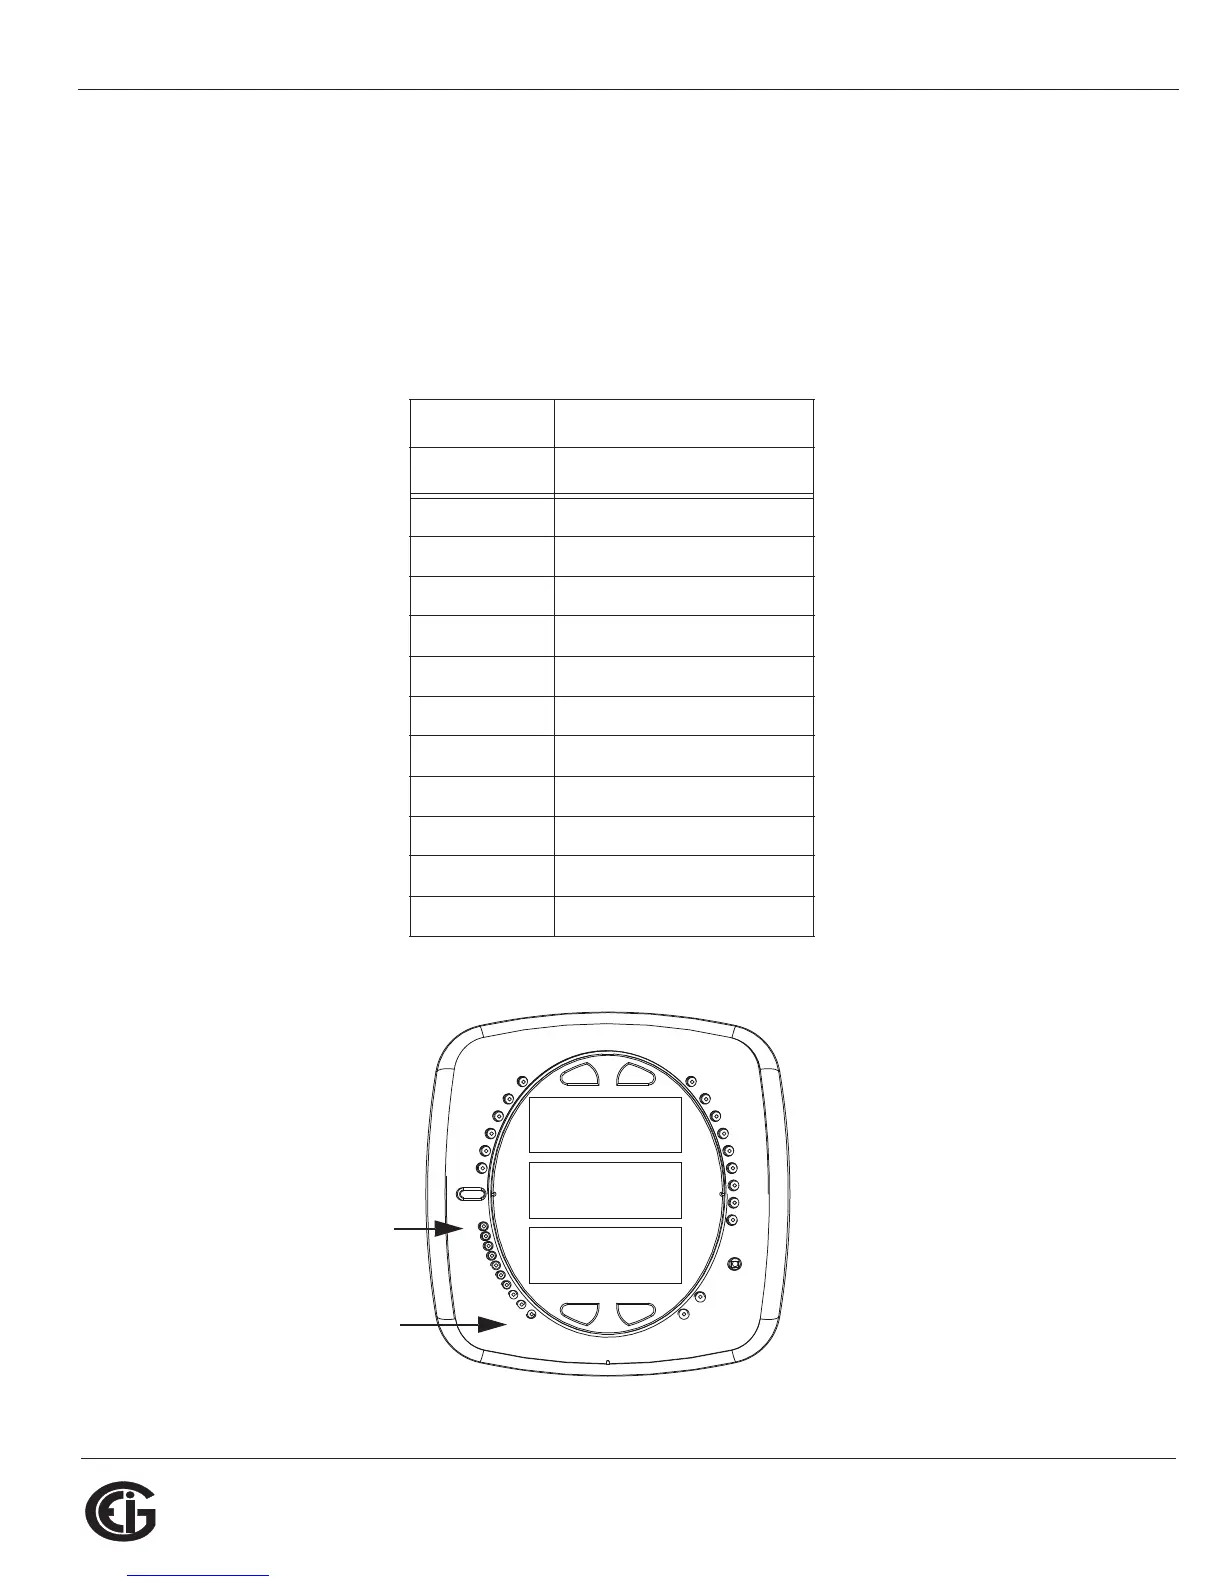
6.3: Understanding the % of Load Bar
The 10-segment LED bar graph at the bottom left of the Shark® 100/100B/50
meter’s front panel provides a graphic representation of Amps. The segments light
according to the load, as shown in the table below.
When the Load is over 120% of Full Load, all segments flash “On” (1.5 secs) and “Off”
(0.5 secs).
Segments Load >= % Full Load
none no load
11%
1-2 15%
1-3 30%
1-4 45%
1-5 60%
1-6 72%
1-7 84%
1-8 96%
1-9 108%
1-10 120%
All Blink >120%
0000
-
-
-
A
B
C
MENU ENTER
MAX
MIN
LM1
LM2
%THD
PRG
VOLTS L-N
VOLTS L-L
AMPS
WNARP
VA/Hz
lrDA
Wh
VARh
VAh
120%-
90%-
60%-
30%-
%LOAD
MEGA
KILO
Wh Pulse
1
10