Doc# E145701 1-15
1: Three-Phase Power Measurement
Electro Industries/GaugeTech
The Leader In Power Monitoring and Smart Grid Solutions
Electro Industries/GaugeTech
The Leader In Power Monitoring and Smart Grid Solutions
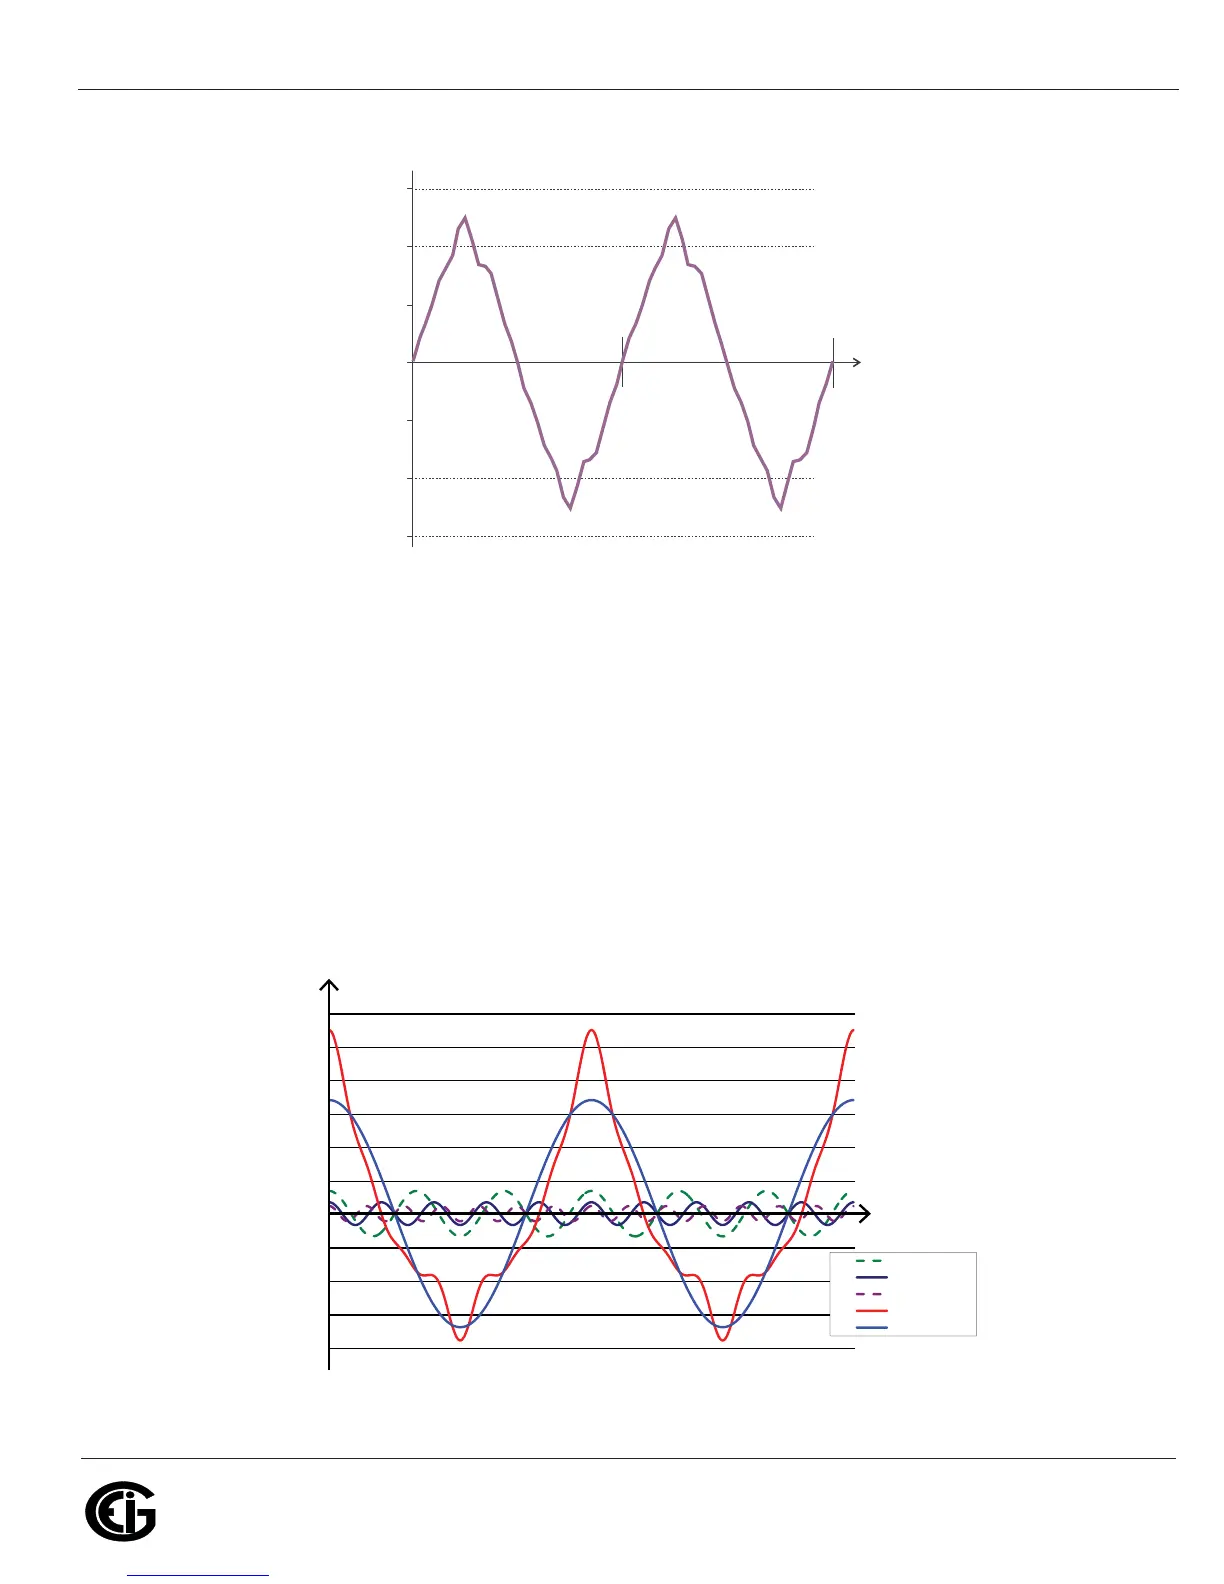
Figure 1.11: Distorted Current Waveform
The distortion observed in Figure 1.11 can be modeled as the sum of several
sinusoidal waveforms of frequencies that are multiples of the fundamental 60 Hz
frequency. This modeling is performed by mathematically disassembling the distorted
waveform into a collection of higher frequency waveforms.
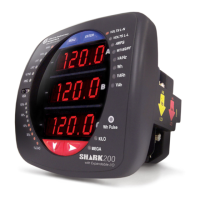
These higher frequency waveforms are referred to as harmonics. Figure 1.12 shows
the content of the harmonic frequencies that make up the distortion portion of the
waveform in Figure 1.11.
Figure 1.12: Waveforms of the Harmonics
–1000
–500
0
500
1000
t
)spma( tnerruC
a
2a
–1500
1500
Time
Amps
3rd harmonic
5th harmonic
7th harmonic
Total
fundamental
– 500
0
500
1000