User Manual 7 iSolarCloud App
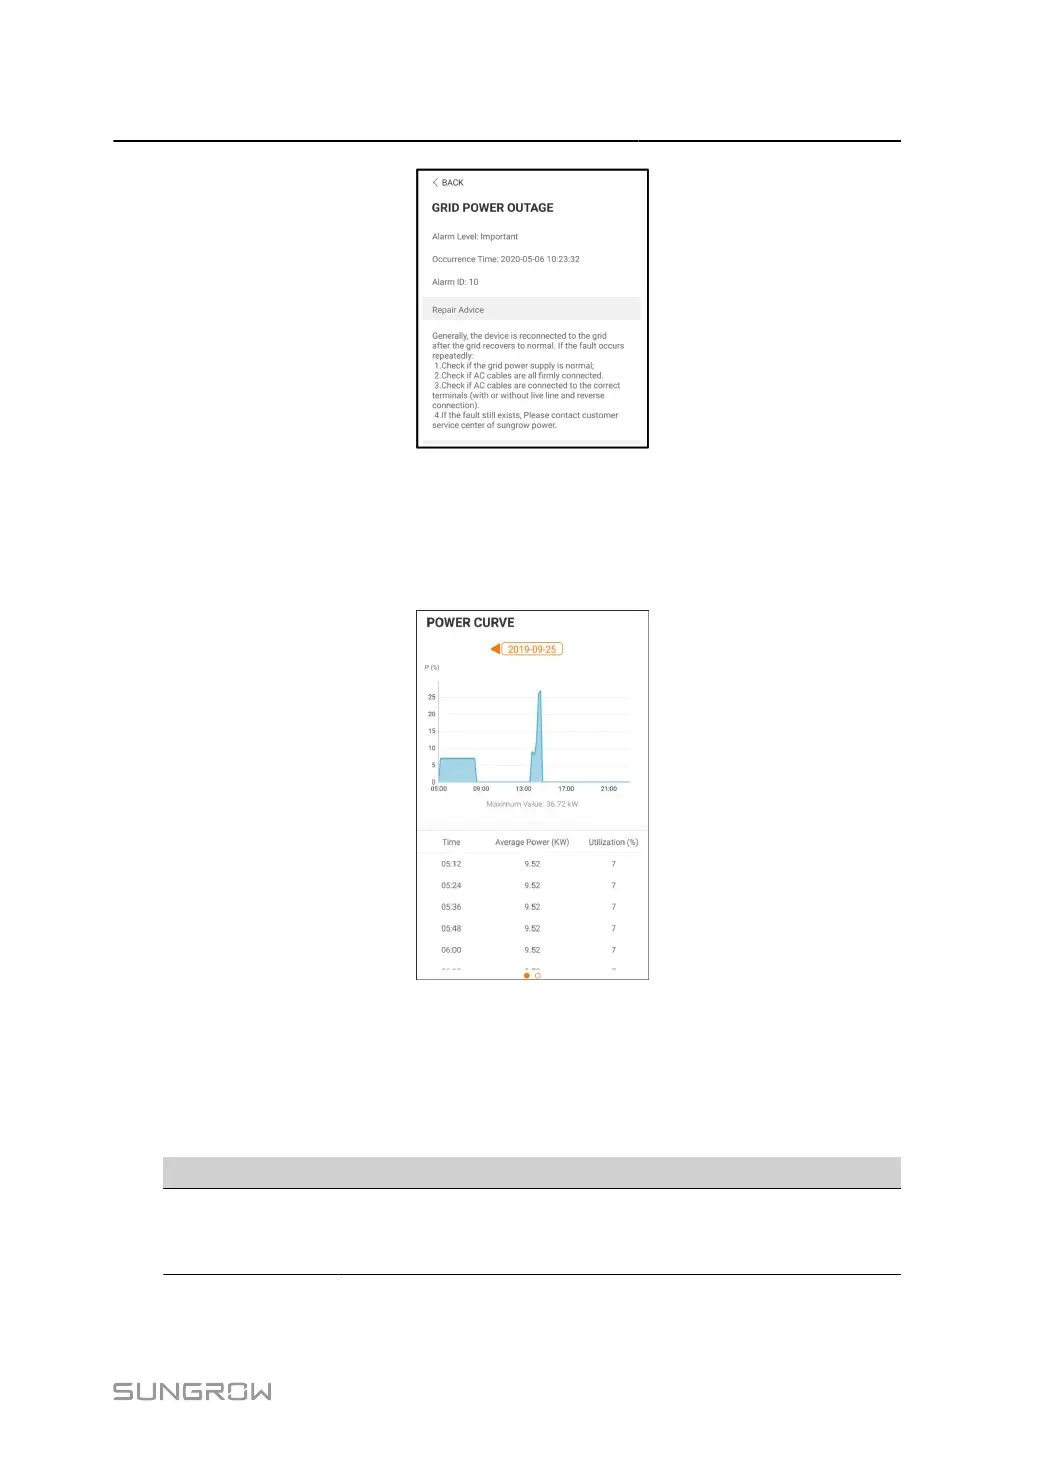
figure 7-9 Detailed Fault Alarm Information
Yield Record
Tap Yield Record to enter the interface showing daily power generation as shown in the fol
lowing figure.
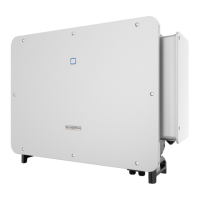
figure 7-10 Power Curve
The App displays power generation records in a variety of forms, including daily power gen
eration graph, monthly power generation histogram, annual power generation histogram and
total power generation histogram.
table 7-6 Yield Record Explanation
Parameter Description
Power curve
Shows the power output from 5 am to 11 pm in a single day. Each point
on the curve represents the percentage of present inverter power to
rated power.
85