82
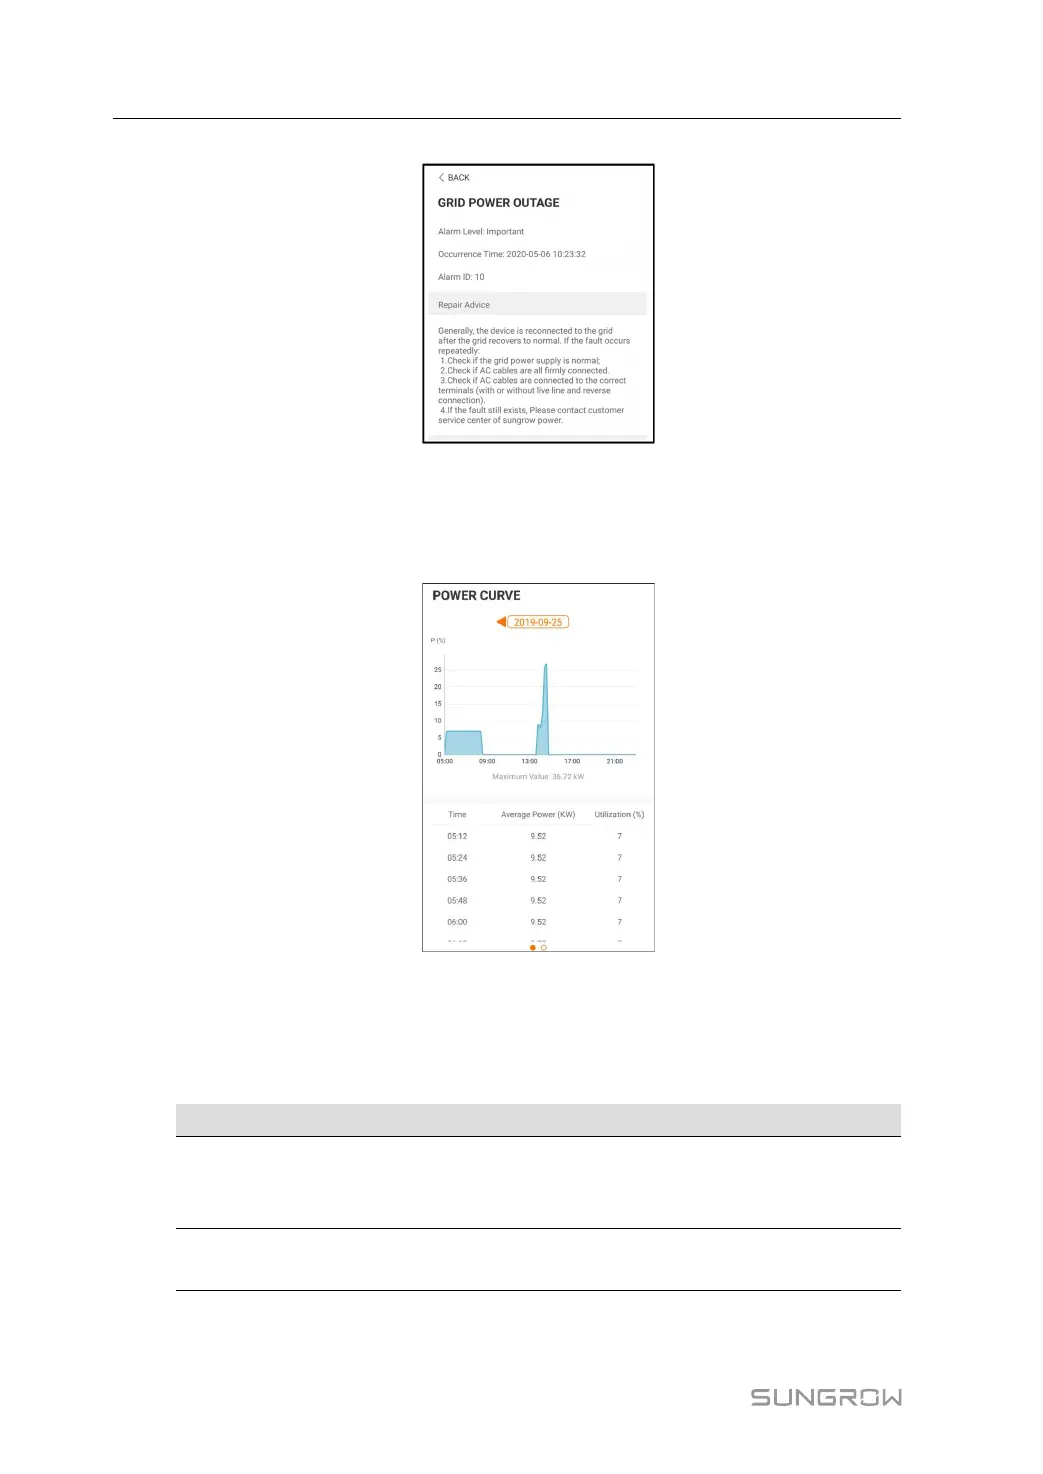
figure 7-9 Detailed Fault Alarm Information
Yield Record
Tap Yield Record to enter the interface showing daily power generation as shown in the
following figure.
figure 7-10 Power Curve
The App displays power generation records in a variety of forms, including daily power
generation graph, monthly power generation histogram, annual power generation histogram.
table 7-7 Yield Record Explanation
Parameter
Description
Power curve
Shows the power output from 5 am to 23 pm in a single day. Each
point on the curve represents the percentage of present inverter
power to rated power.
Daily yield
histogram
Shows the power output every day in the present month.
7 iSolarCloud App User Manual
 Loading...