Press
,
to select the Cell need to check Trend Curve. ⑥
Press
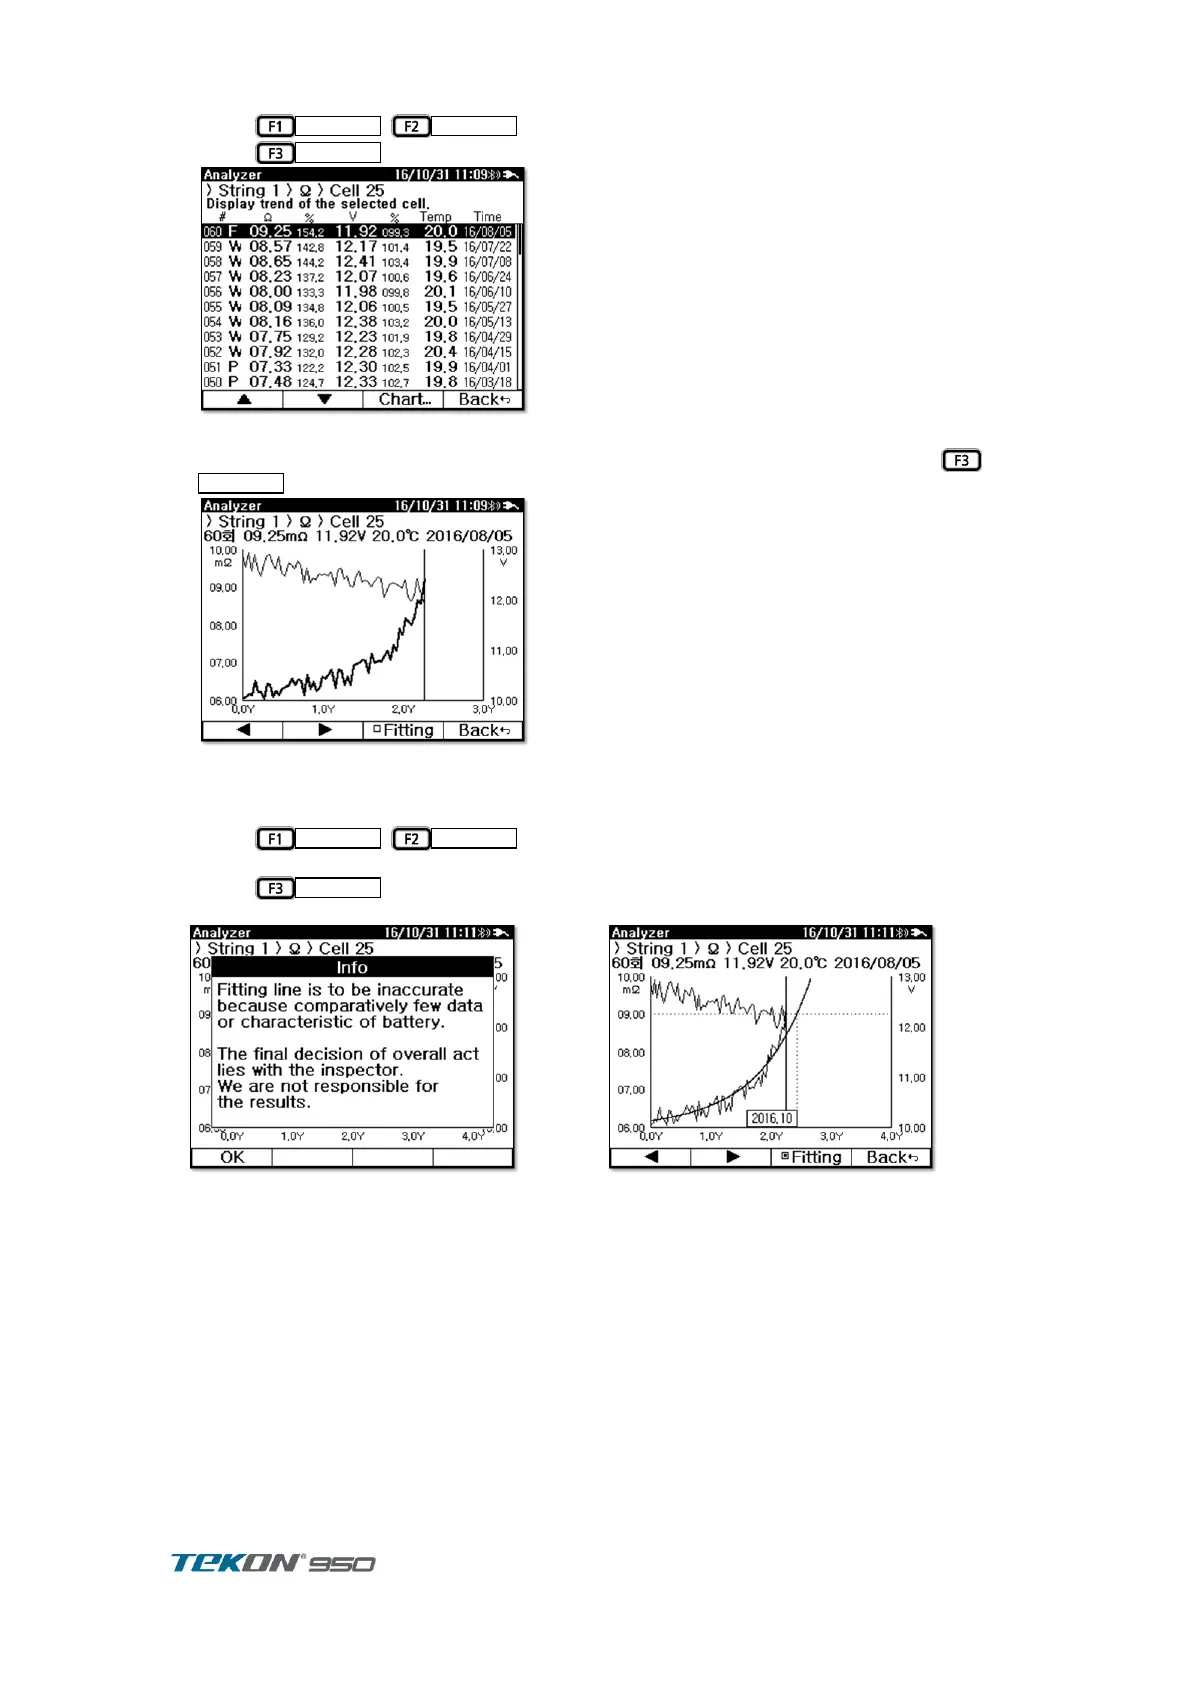
to display selected cell record ⑦
Figure 72. Cell Record
Measurement trend can be seen in Chart , in the order of measurement time. Press ⑧
to display in Chart .
Figure 73. Cell Chart
Measurement value change by time of selected cell can be checked in Chart Impedance ⑨
change displayed in Bold line, Voltage change displayed in thinner line.
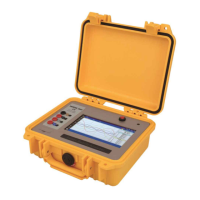
Press
,
to move cursor. Cursor point indicate measurement ⑩
value and Time.
Press
to display Trend Curve and indicates when the Trend curve reach ⑪
Upper Level 2.
Figure 74. Trend Curve Information