Analyze Wavefor
mData
The vertical cu
rsor lines on the display
measure horizontal parameters, typically
time.
The square and circle shapes in the readout map to the multipurpose knobs when both vertical and horizontal cursors
are present.
Using XY Cur
sors
When the XY D isplay mode is on, the cursor readouts will appear to the right of the lower graticule (XY). They will include
rectangular, polar, product, and ratio readouts. The oscilloscope will display vertical-bar waveform cursors in the upper
graticule (YT).
SettingUpaHistogram
You can display a vertical (voltage) or horizontal (time) histogram. Use histogram measurements to get statistical
measurem
ent data for a section of a w aveform along one axis. The sources for a histogram can be any of the four analog
channels, a math waveform, or any of the four reference waveforms.
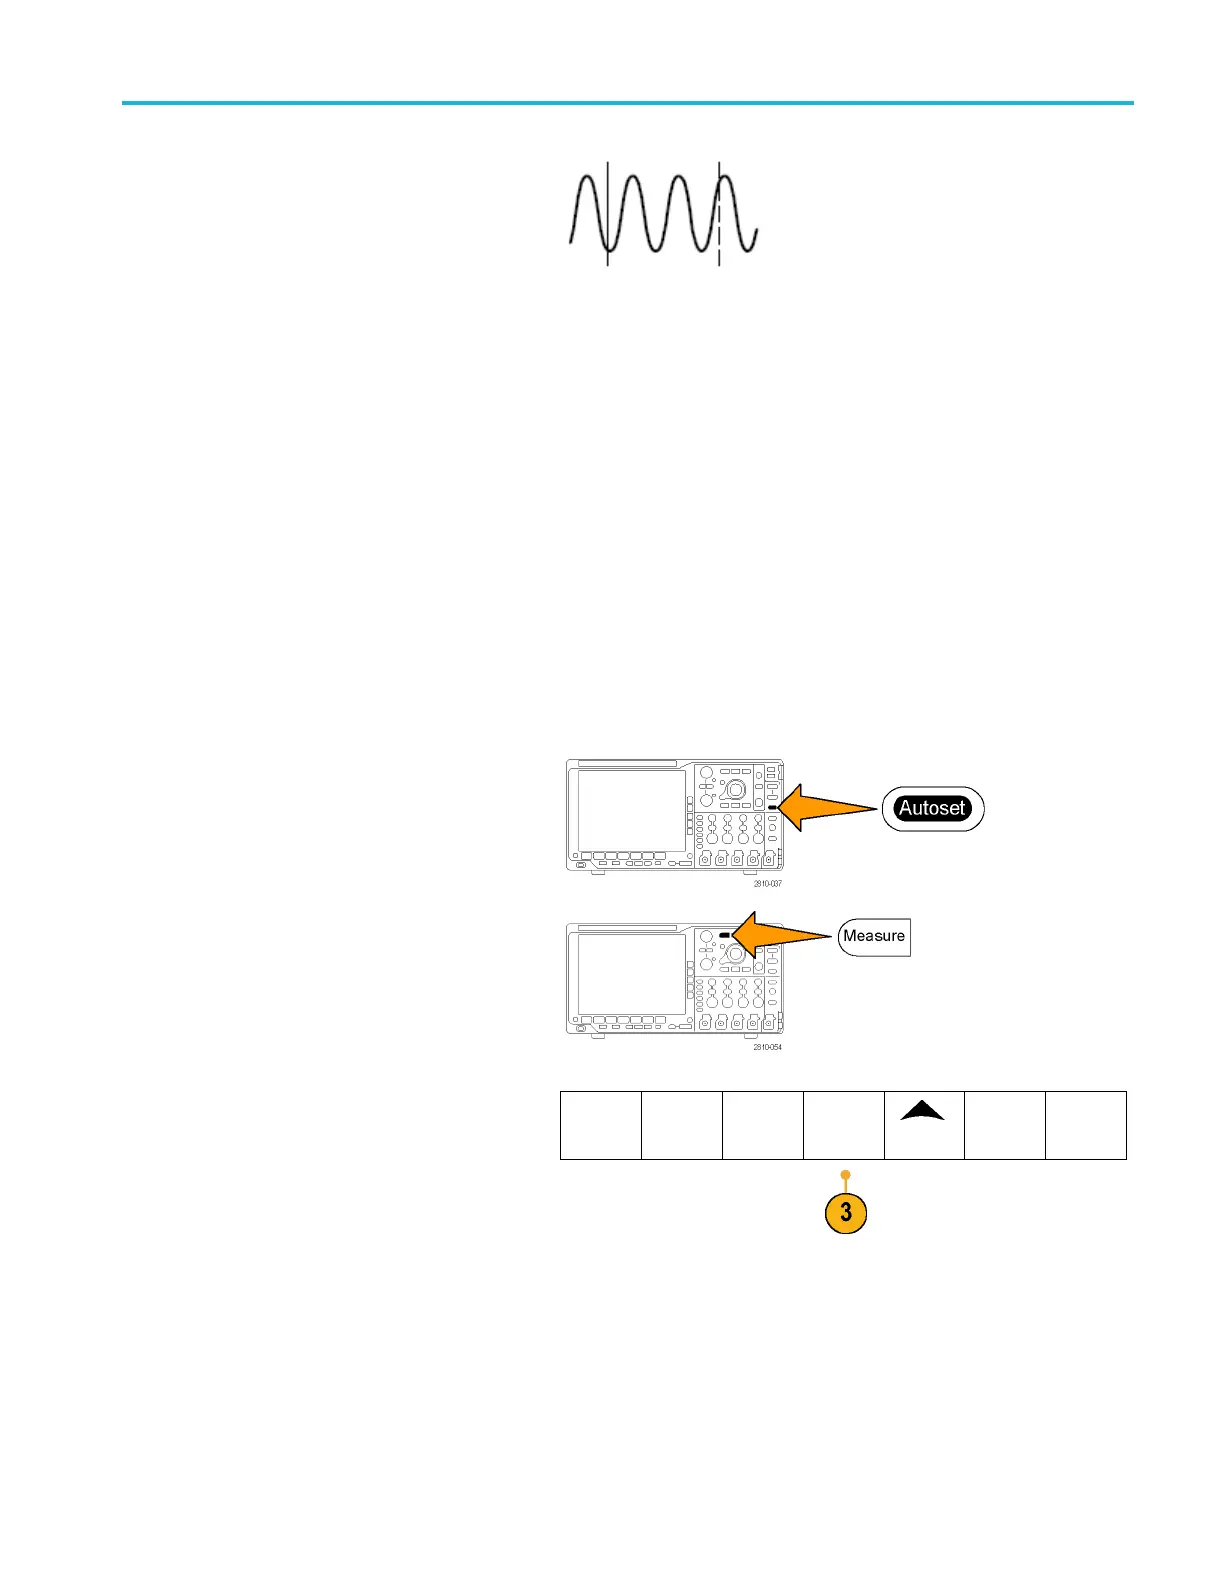
To Display a Histogram
1. Set up the oscilloscope to show the
waveform on which to measure the
histogram. Use Autoset if appropriate.
2. Push Measure.
3. Push
Waveform Histograms on the lower
menu.
Add Mea-
sure
ment
Remove
Meas
ure-
ment
Indicators
Waveform
His-
togr
ams
More
Bring
Curs
ors
On Screen
MSO4000B and DP O4000B Series Oscilloscopes User Manual 117
 Loading...