Analyze Wavefor
mData
5. Push Reset Statistics on the side m enu.
Reset
Statistics
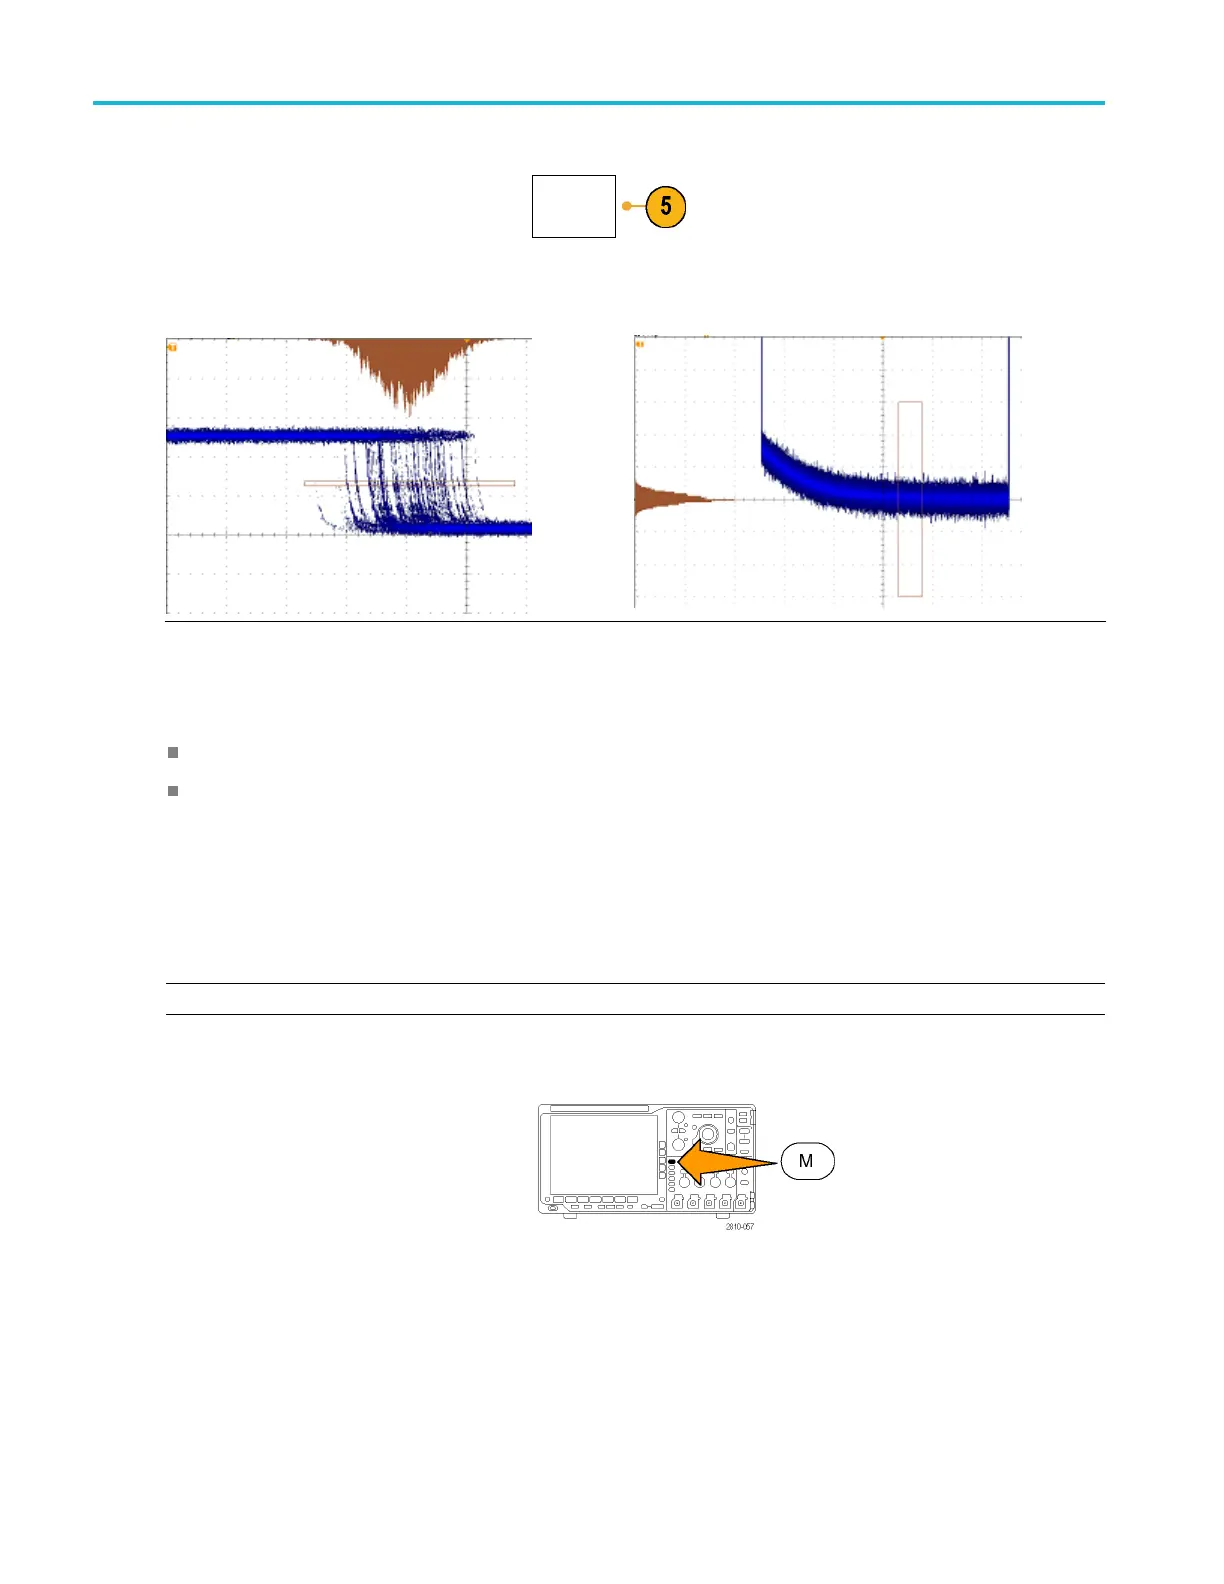
You can view t
he histogram at the top (for horizontal histograms) or the left edge (for vertical histograms) of the graticule.
Quick Tip
s
Use horizontal histograms to measure signal jitter.
Use vertical histograms to measure signal noise.
Using Math Waveforms
Create
math waveforms to support the analysis of your channel and reference waveforms. By combining and transforming
source waveforms and other data into math waveforms, you can derive the data view that your application requires.
NOTE. Math waveforms are not available for use with serial buses.
Use the following procedure for executing simple (+, –, *, ÷) math operations on two waveforms:
1. Push Math.
120 MSO4000B and DPO 4000B Series Oscilloscopes User Manual
 Loading...