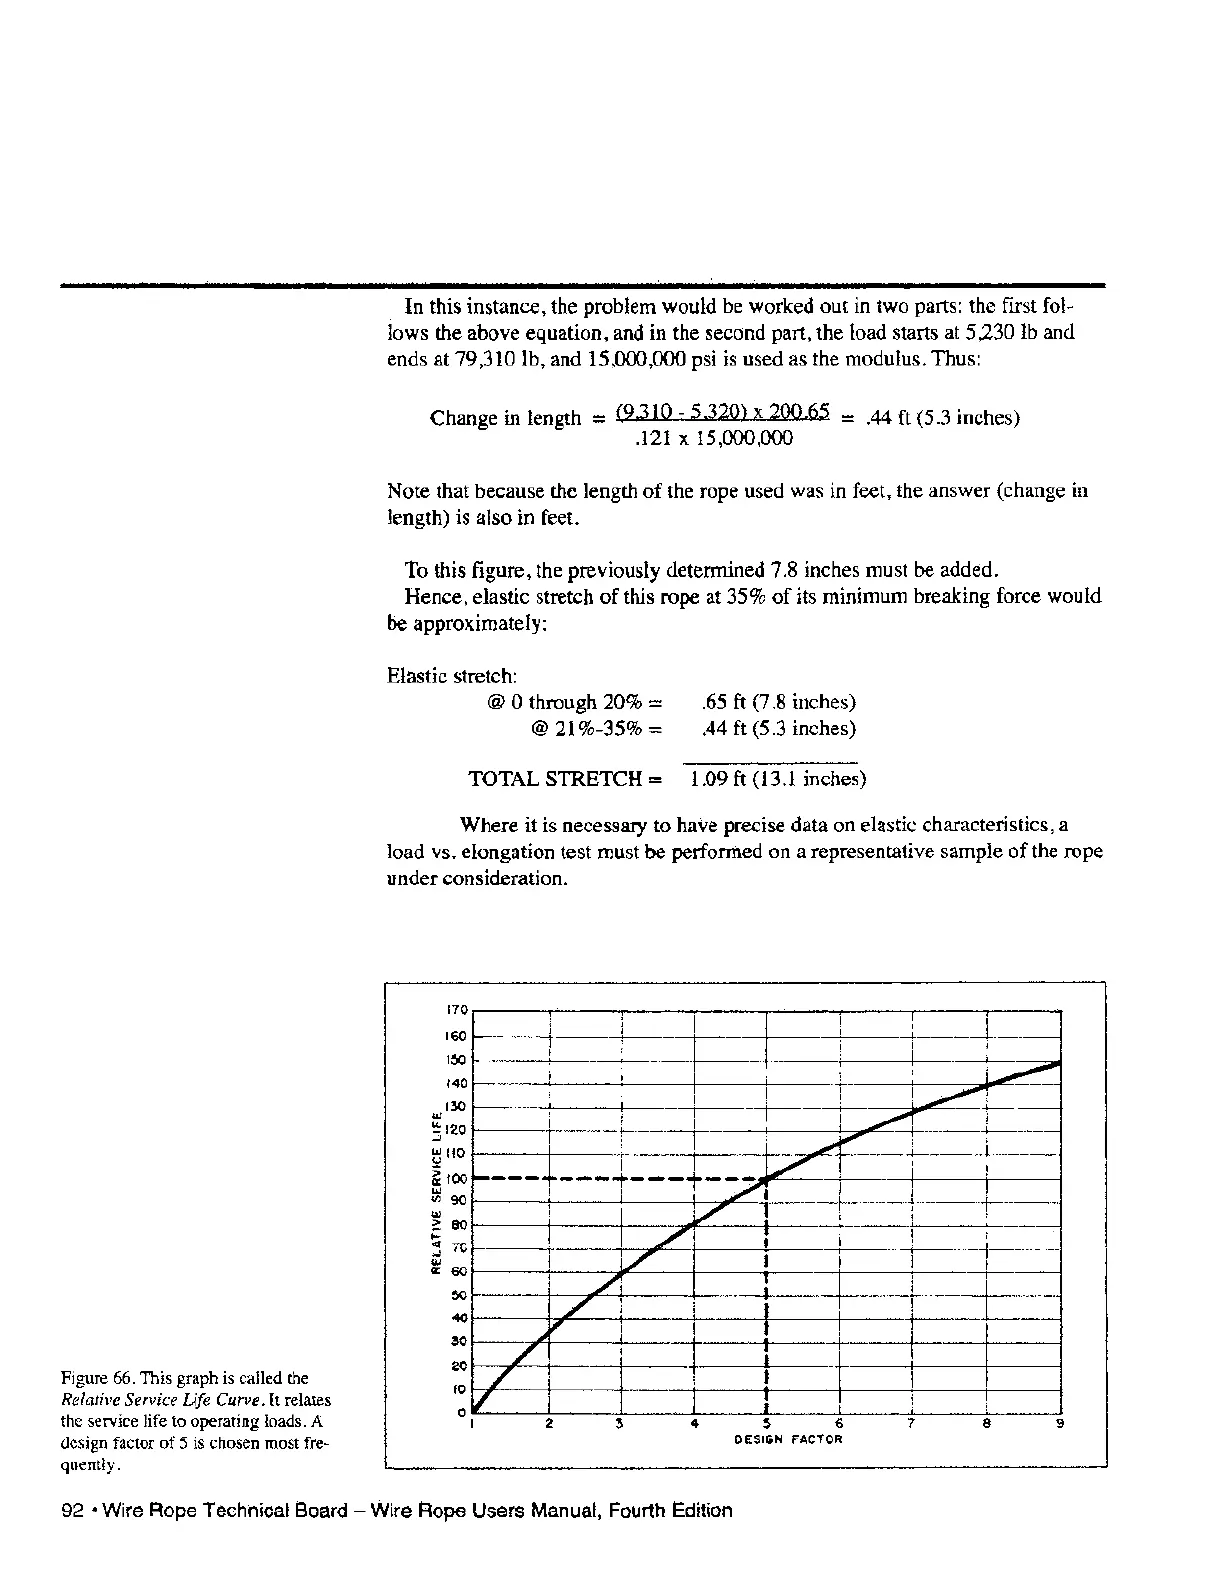
Figure 66. This graph is called the
Relative Service Life Curve. It relates
the service life to operating loads. A
design factor
of
5 is chosen most fre-
quently.
In
this instance, the problem would be worked out in two parts: the first fol-
lows
the above equation, and in the second part, the ioad starts at 5,230
Ib
and
ends at 79,310
lb,
and 15,000,000 psi is used as the modulus. Thus:
Change in length
= (9.310 - 5,320) x 200.65 = .44 ft (5.3 inches)
...
.121 x 15;000,000
Note that because the length
of
the rope used was in feet, the answer (change in
length) is also in feet.
To this
figure
j
the previously determined 7.8 inches must be added.
Hence, elastic stretch
of
this rope at 35%
of
its minimum breaking force would
De
approximately:
Elastic stretch:
@ 0 through 20% =
@ 21%-35% =
TOTAL STRETCH
:::
.65
ft
(7.8 inches)
.44
ft (5.3 inches)
1.09
ft
(13.1 inches)
Where it is necessary
to
have precise data on elastic characteristics, a
load vs. elongation test must be
perforl1led on a representative sample
of
the rope
under consideration.
...,.
170
160
150
140
130
3
120
~IIO
~
100
...,
CI'i
90
!oJ
~80
....
;:\1C
...
11::60
50
40
30
20
10
o
~-
...
-
jo----
/
./'
~~
./
7
1/
1
2
~
I
I
~,
:/
.JII'
~
._
..........
""
............
I7'
7 .
V
./
;
-_.-
-.-.¥.~-.~-
1/
I
I
I
4
~
6
7
8 9
DESIGN FACTOR
92·
Wire
Rope
Technical
Board
-
Wire
Rope
Users
Manual, Fourth Edition