7 Using the product
55
7.2.4.2 Table view
The readings are listed in table form in this view.
In the Start | View menu, the Table command is activated. You now
have to select the data record that you wish to display.
In the calendar, select the day or time period that needs to be
evaluated.
In the tree structure of the data range, open the zone that contains the
data to be displayed.
The table view of the selected data is displayed.
If necessary, deactivate channels via the checkboxes for the display.
Marking readings
Mark specific readings, for example to perform a statistical computation for part
of the measurement series.
The min, max and mean values cannot be determined via a time
period/index range defined in the table.
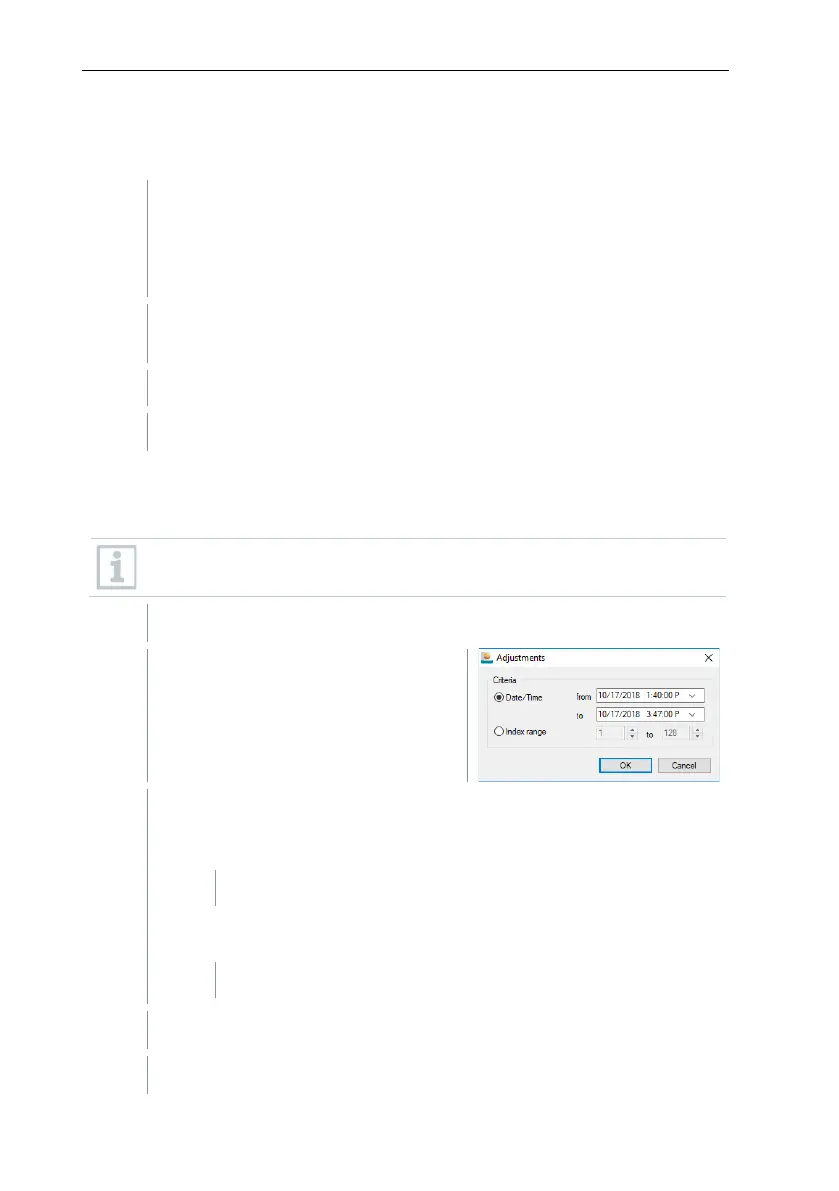
Click on Edit | Tools | Mark.
A dialogue for determining the criteria
is displayed.
Select the Date/time option if the readings for a specific time period
need to be marked.
•
The selection lists for determining the time period are enabled.
• Select Index range if the readings in specific table rows need to be
marked.
The selection lists for determining the index range are enabled.
Determine time period or index range.