3.4 Operating Instruction
PM100 / page 26
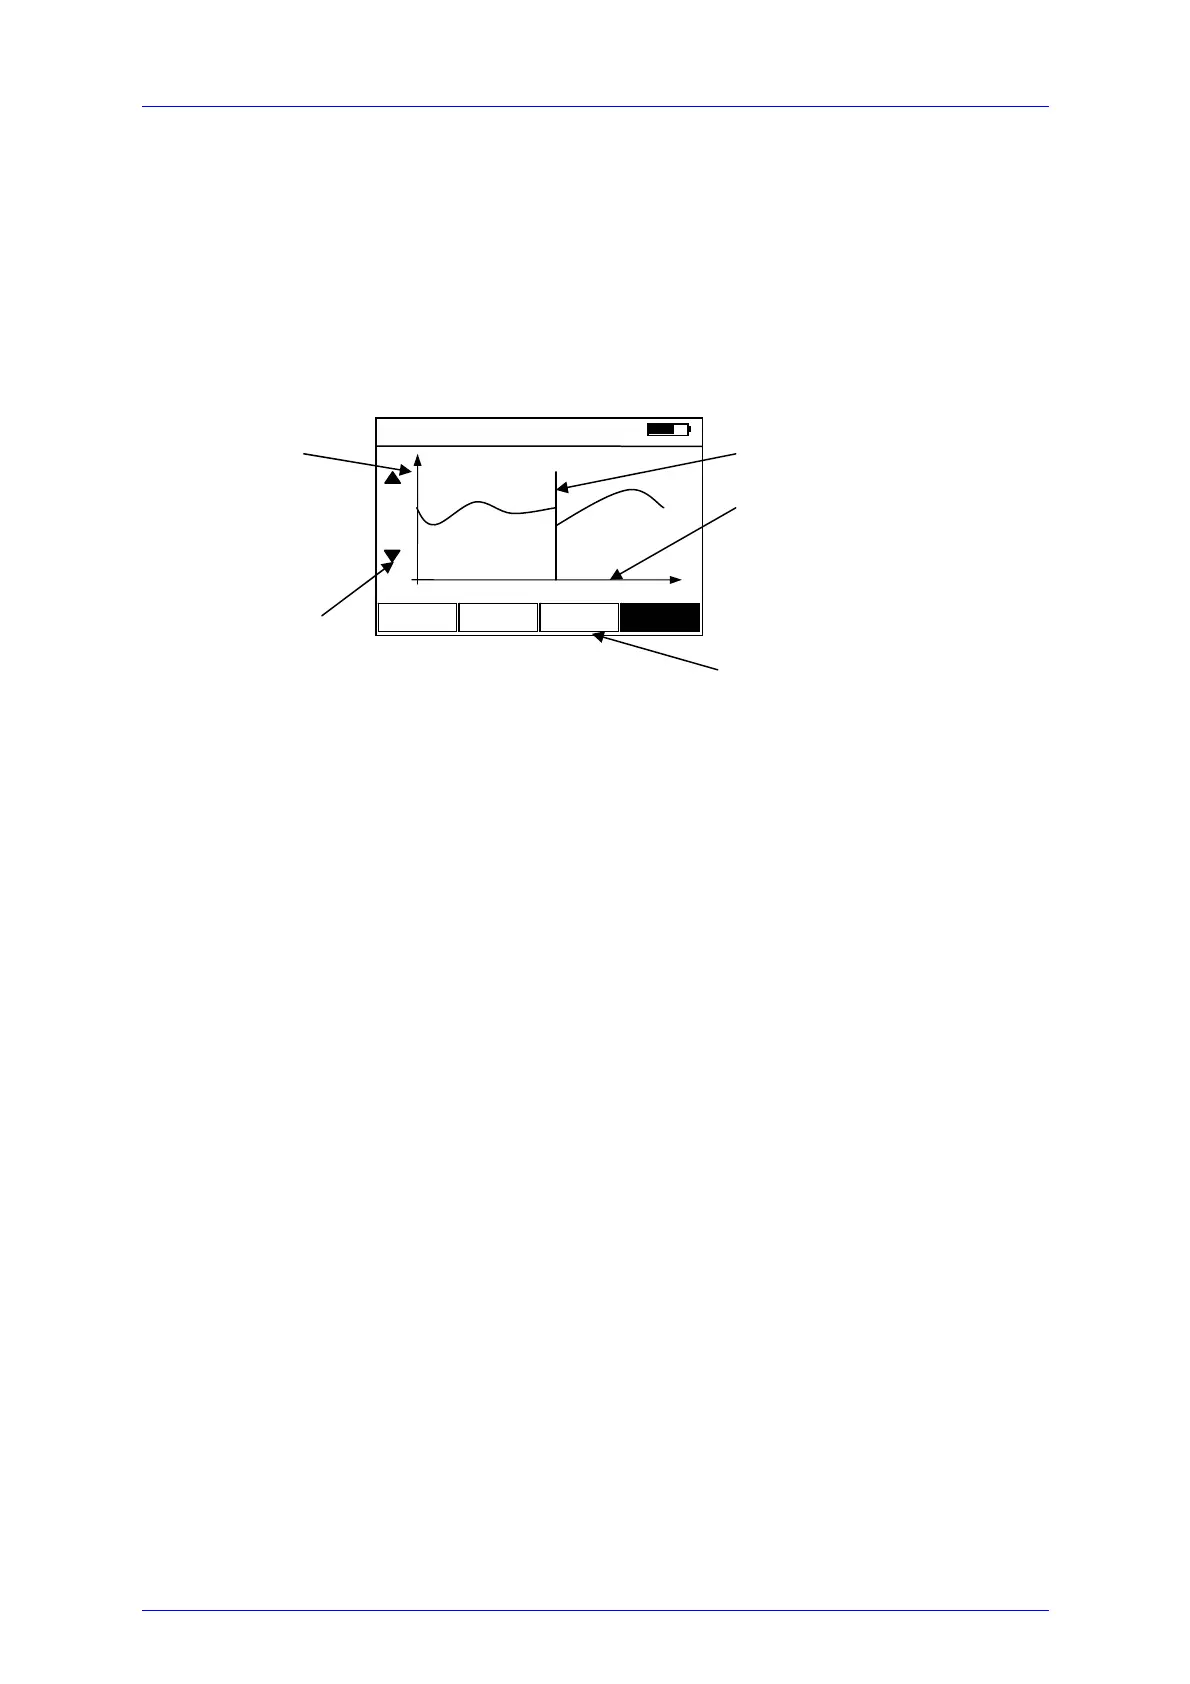
3.4.9.3 Tune-Graph Display
The tune-graph display shows power readings over time in an oscilloscope like style.
The time axis is adjustable by the ‘Time-base’ soft key that selects the number of
readings per time, the power axis can be adjusted by the range and zoom settings. A
cursor indicates the current reading.
Figure 8 Tune-Graph Display
Special topics on the display soft keys:
The graph starts at zero after changing the range, zoom or time-base. The REL∆
zeroing function is not available in this display. The auto-range function will be
disabled when entering this display.
• Zoom: Adjusting zoom spreads the needle scale by a factor of 3 and
10. Zoom 1x indicates that the zoom function is switched off.
• Range: Ranges are set in logarithmic half decade cycles (3, 10, ..)
by pressing the up and down arrow buttons. Over or under-
range is indicated by up and down arrows on the left side of the
power axis.
Zoom 1 x 10 mW 6/s Menu
Time-base: Toggles the
sampling frequency from
6/s to 9/min
Time axis: adjustable
from 30s to 20min full
scale by time key
Cursor for current reading
λ1 = 780 nm
Si 50mW
a = 10.00 dB
Power axis:
adjustable by range
and zoom key; scale
updates
automatically.
The arrows indicate
over-/under-range
conditions