2.3 Display Arrangement
PM100 / page 5
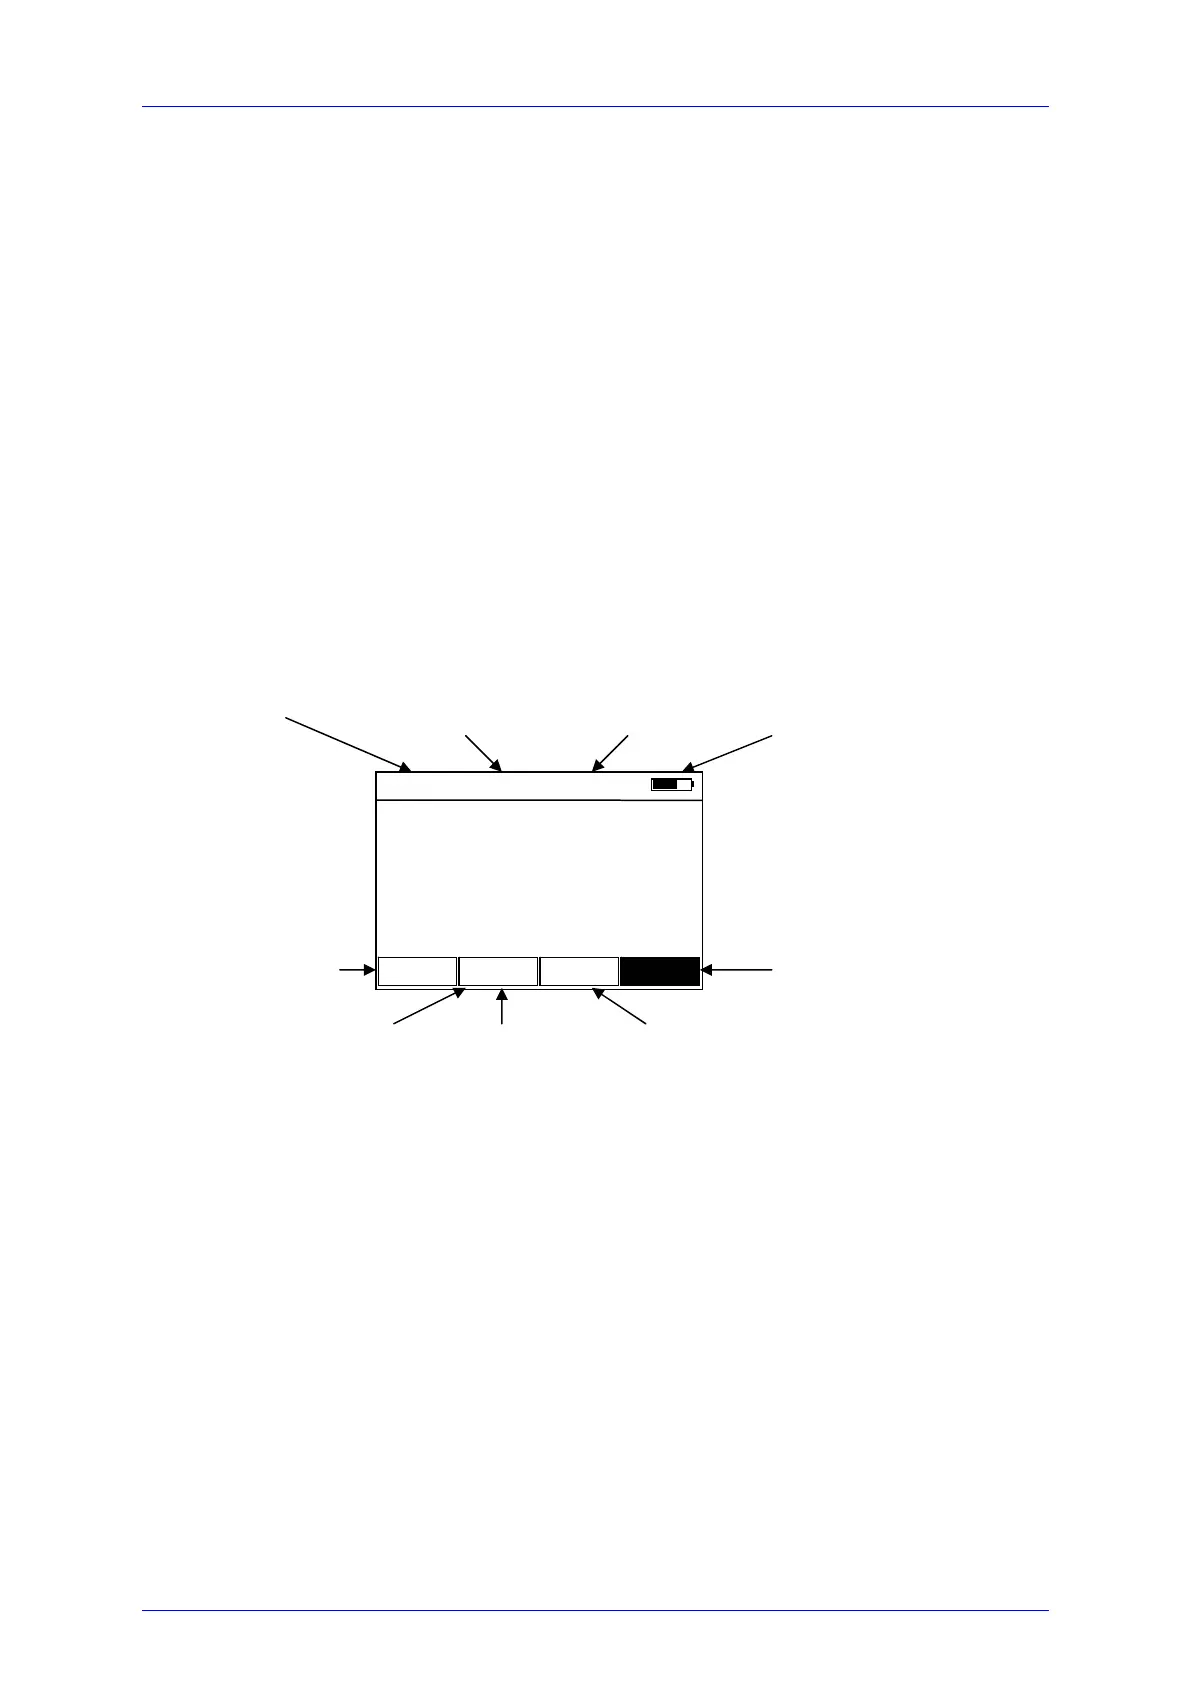
2.3 Display Arrangement
The display is divided into three horizontal sections that allow the user to view all
relevant information on a single screen:
• The top section with sensor, wavelength correction, attenuation correction and
battery info.
• The main display for measurement values, graphs and charts.
• The bottom section with soft buttons, operated by the arrow keys. Left/Right
activates the soft buttons, Up/Down changes the values. The activated button
is indicated in reverse style.
Figure 1 Display Arrangement
Main Display
λ1 = 780 nm
Si 50mW
Zoom 1 x 10 mW Abs. Menu
A
R
Sensor: indicates
type and maximum
sensor power
Wavelength Correction:
Indicates current
wavelength setting
Battery status bar:
Filled rectangle
indicates fully
char
ed batter
Zoom factor for the
analog displays
(needle, bar-graph,
tune
ra
h
Auto-Range
indicator: Shows
up when auto-
ran
e is activated
Measurement
range indicator
Relative display:
If REL∆ is activated the
difference to zero is
indicated in this button
Menu button:
Enters sub menus;
Toggles between the
measurement dis
la
s
Attenuation Correction:
Indicates current
attenuation setting
a = 10.00 dB