3.4 Operating Instruction
PM100 / page 27
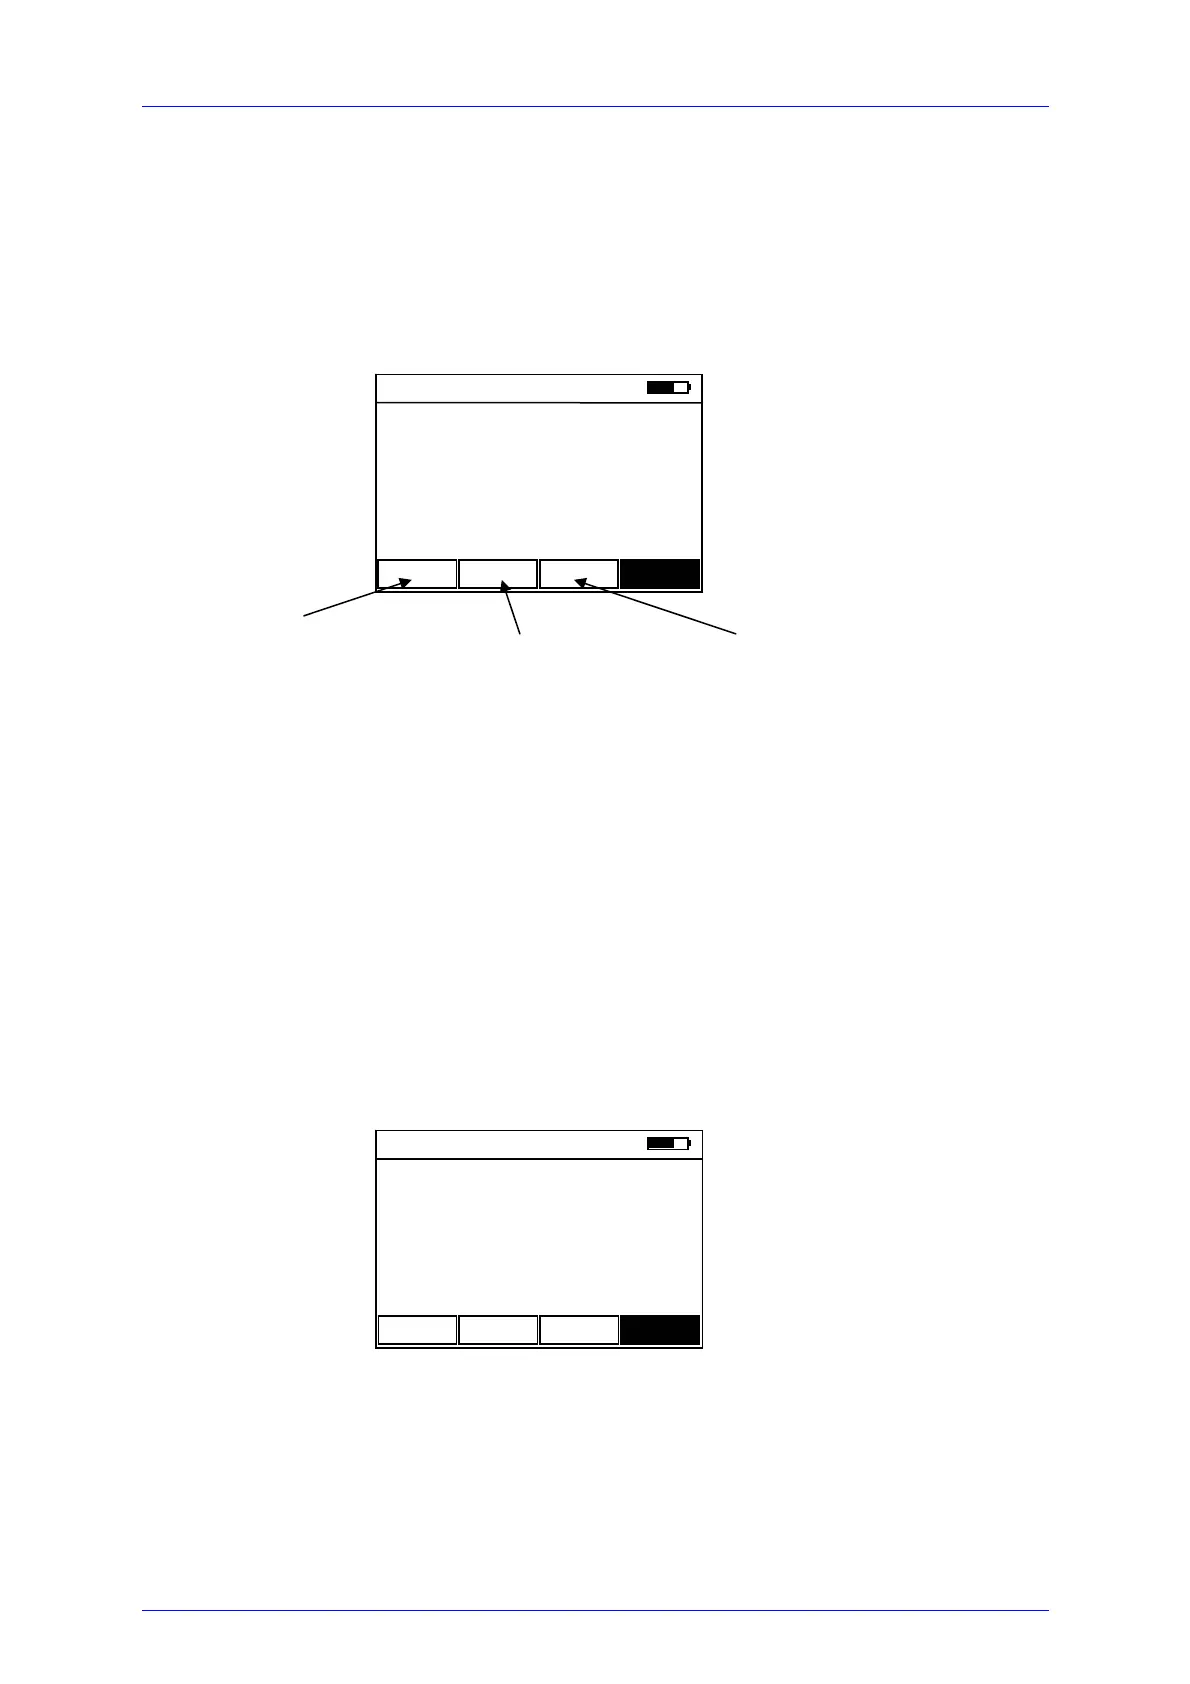
3.4.9.4 Statistics Display
The statistics display shows simultaneously extreme, average and standard deviation
measurement values over time to conduct for example pass/fail tests. The display is
easy to operate by the three soft keys: Start, Stop and Reset. The meter switches
automatically in auto-range. The Range and REL∆ will be set out of order.
Figure 9 Statistics Display
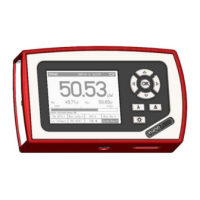
3.4.9.5 Power dBm Display
The power dBm display features a big 4 digit numerical power reading in logarithmic
representation combined with a smaller 4 digit numerical power reading in Watt. The
display has the same Range and REL∆ functionality than the power Watt display but
no zoom function. When REL∆ is activated the units change from dBm to dB, over or
under-range conditions are displayed by Hi and Lo indicators above the units.
Figure 10 Power dBm Display
Start Stop Reset Menu
Start key to begin
measurement
Stop key to end
measurement
Reset key to zero
the readings
Current Value: 2.304 µW
Minimum Value: 2.276 µW
Maximum Value: 2.213 µW
Average Value: 2.291 µW
λ1 = 780 nm
Si 50mW
a = 10.00 dB
10 mW Abs. Menu
A
R
7.123 dBm
8.473 mW
λ1 = 780 nm
Si 50mW
a = 10.00 dB