Chapter 5 _______________________________________________________ Plot-Assisted Setups
VAISALA______________________________________________________________________ 167
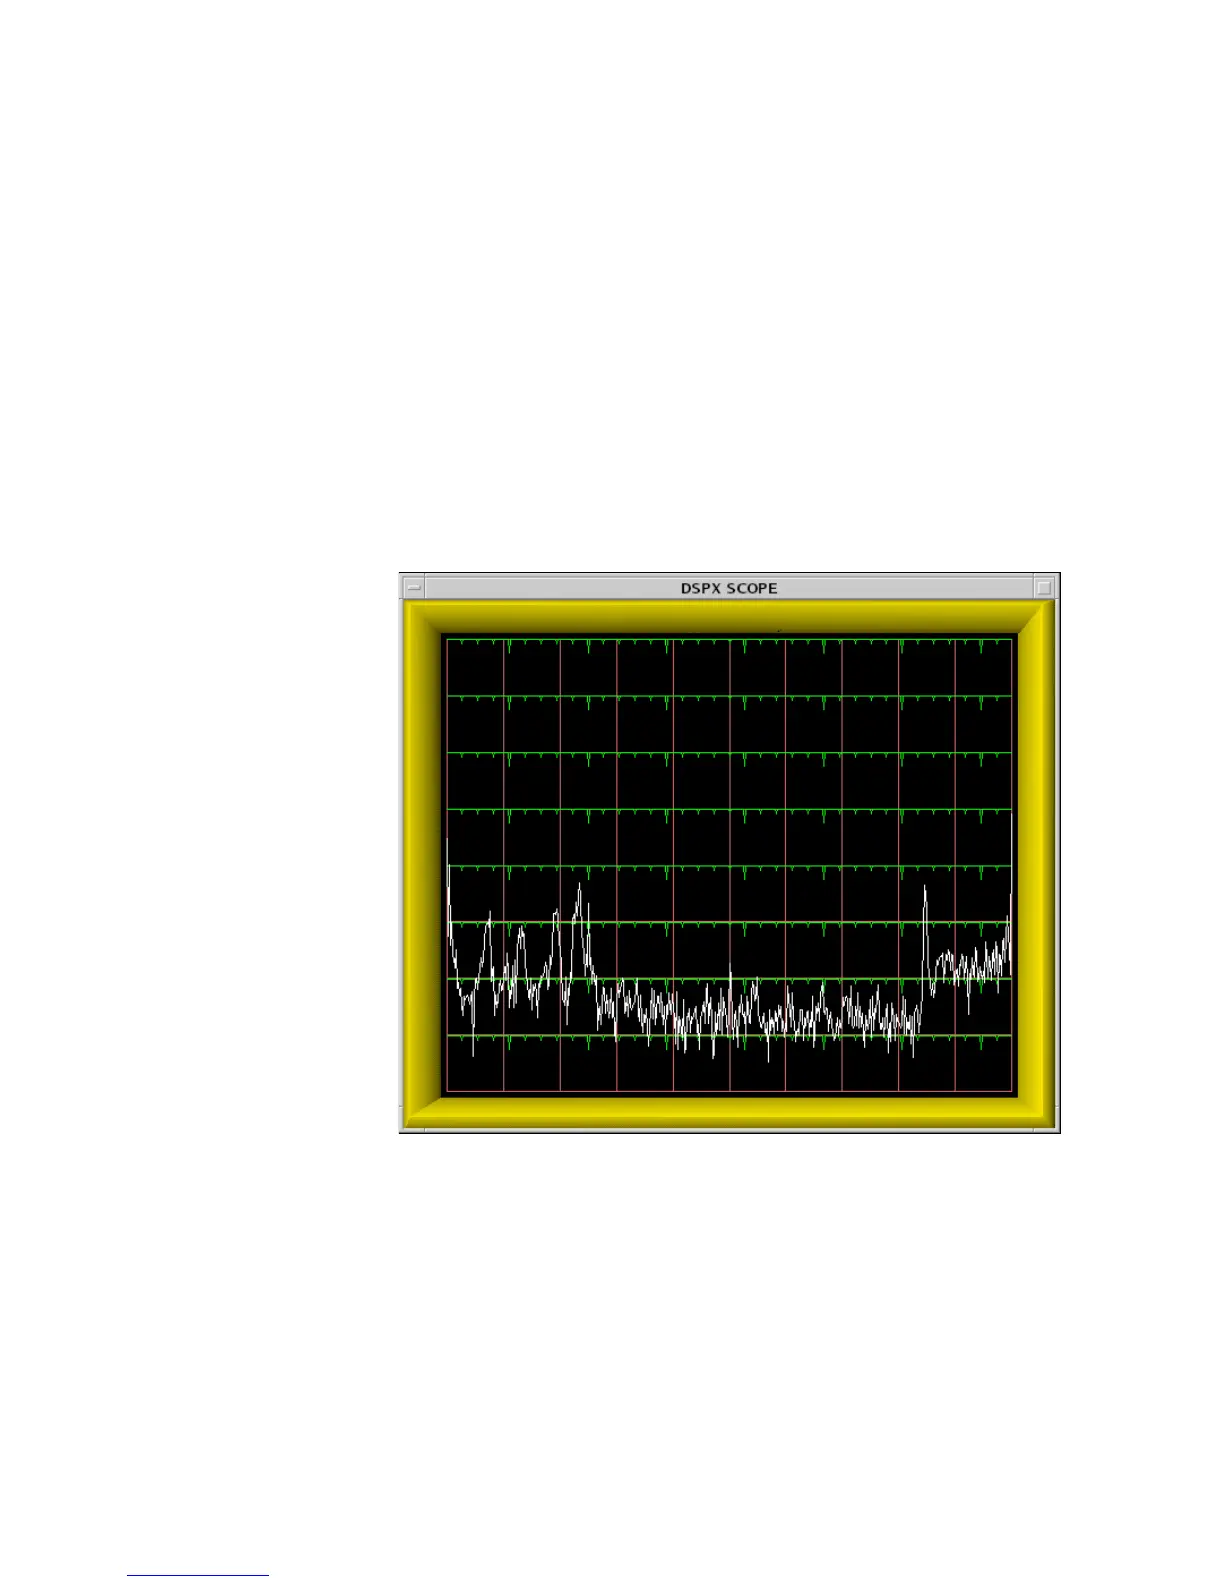
overall span of 80 dB is visible. This particular plot was made with the
time span set to 50 µsec, and with a 1 m antenna attached to the IF input so
that a broad range of signals (radio stations, electrical noise, etc.) would be
detected.
The purpose of the Pr power spectrum is to check for spurious interference
in the IF signal from the radar receiver. The spectrum should be viewed
with the transmitter turned off, and with the starting range moved out so
that the burst samples are not mixed in with the receiver data. The power
spectrum is computed using the complete interval of raw IF samples
which, depending on the chosen time span, may contain many hundreds of
points. The frequency resolution of the Pr spectrum can therefore be quite
fine; making it possible to discern any interfering frequencies with some
detail.
0916-045
Figure 31 Example of a Noisy High Resolution Pr Spectrum
The Pr spectrum plot will properly show a 0 Hz peak from any DC offset
in the A/D converter, and is thus consistent with how the DC offset is
presented in the Pr sample plot. Both of these plots preserve the DC
component of the IF samples so that it can be monitored as part of the
routine maintenance of the receiver system. This is one of the few places
in the RVP900 menus and processing algorithms where the DC term
deliberately remains intact.
 Loading...