USER’S MANUAL__________________________________________________________________
172 _________________________________________________________________ M211322EN-D
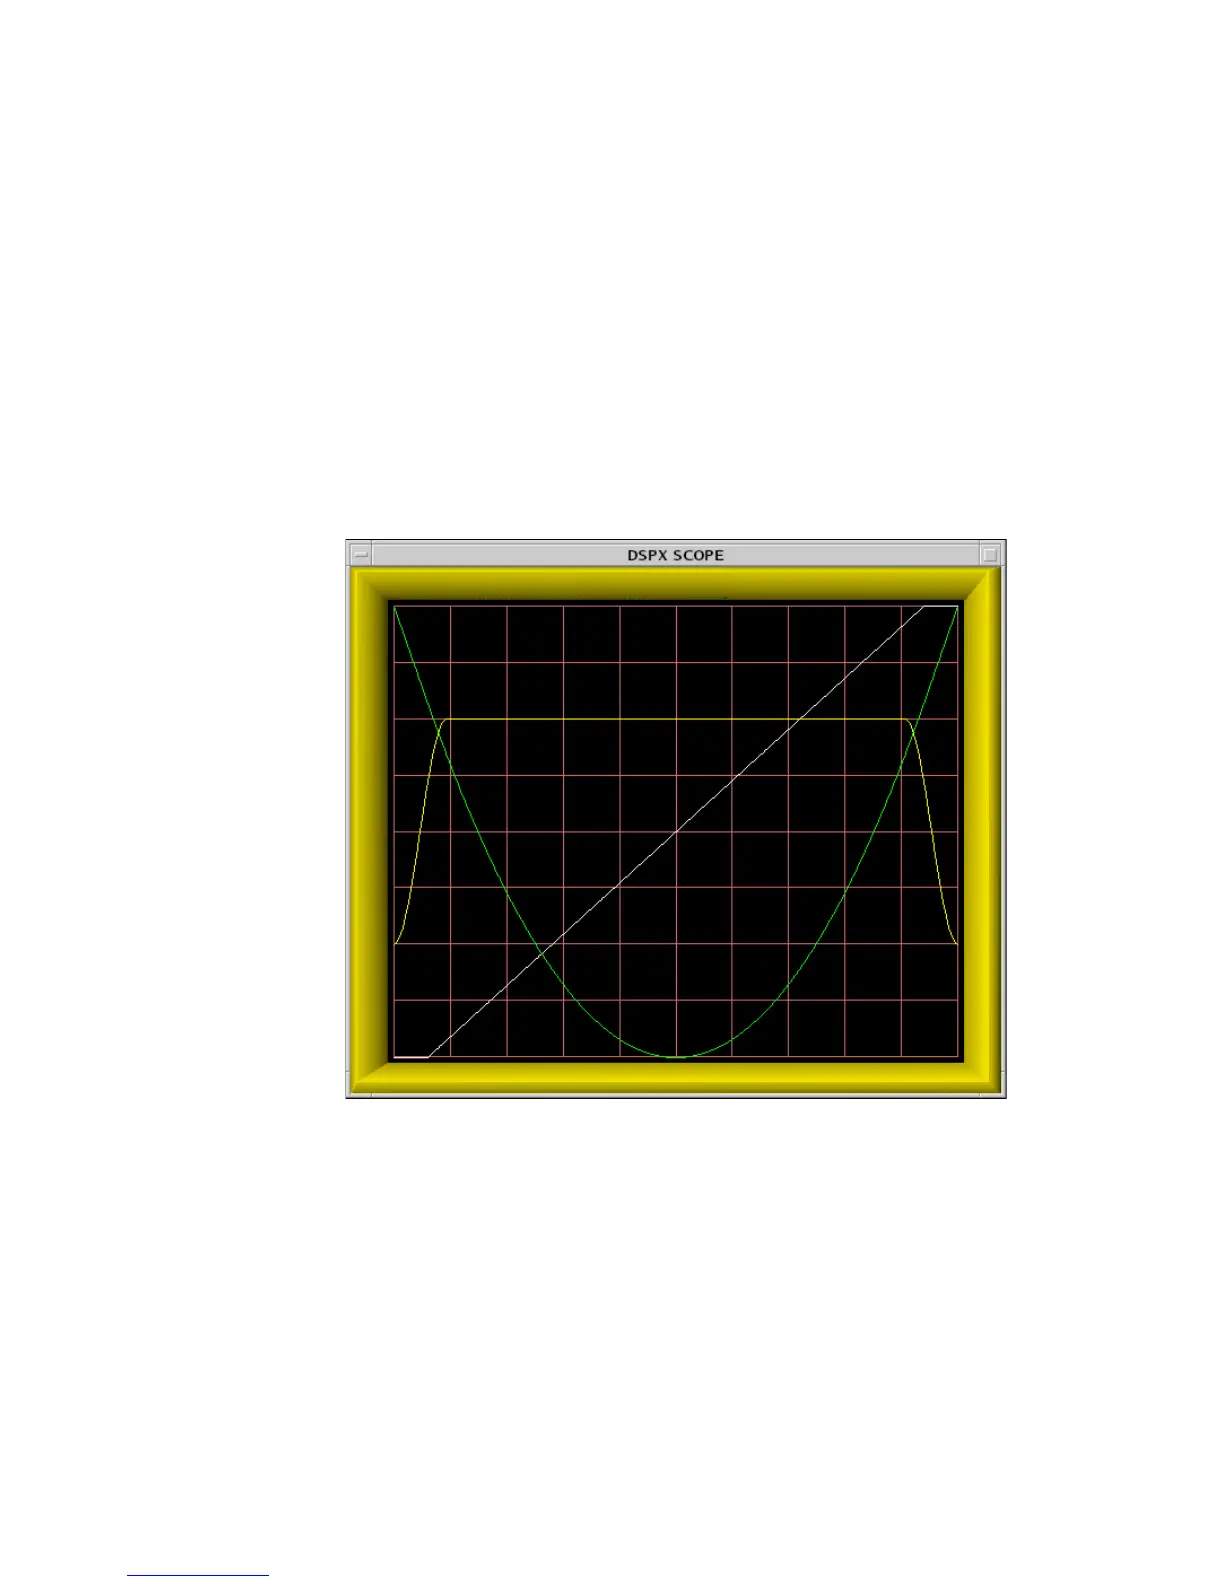
- The instantaneous frequency across the full length of the pulse is
shown in white. The vertical scale is normalized to hold the overall
frequency span, which is also shown numerically in the Pa TTY
output.
- The waveform baseband phase is shown in green, and is normalized
so that the vertical axis holds the full span of values. Note that the
phase, which generally spans a few thousand degrees, is "unwound"
in this plot so that you can see its behavior nicely.
- The amplitude of the Tx waveform envelope is shown in yellow. It is
drawn using a linear vertical scale which occupies only the middle
half of the plot. This is to avoid creating too much "plotting clutter" in
the corners.
0916-047
Figure 33 Frequency, Phase and Amplitude of a Compressed Tx
Pulse
From Figure 33 on page 170 we can see that the waveform consists of a
linear FM chirp that occupies about 87% of the central pulse duration. The
frequency remains nearly constant in the leading and trailing edges, hence
the overall label "Non-Linear FM". The central chirp is contained within a
somewhat larger amplitude modulation envelope that applies full scale
power within the middle 82% of the pulse, and also provides bandlimited
shaping of the leading and trailing edges.
 Loading...