USER’S MANUAL__________________________________________________________________
178 _________________________________________________________________ M211322EN-D
To setup the test, simply connect the Channel #1 or Channel #2 output of
the RVP900/Tx card to the IF-Input of the IFDR. Use whichever
RVP900/Tx channel has been configured for waveform synthesis in the
Mz menu, and set the Zero Offset of the Transmitter Pulse in the Mt<n>
menu to, perhaps, 50µ sec. The latter step will shift the waveform out in
range so that the Pr plot is able to see it.
0916-048
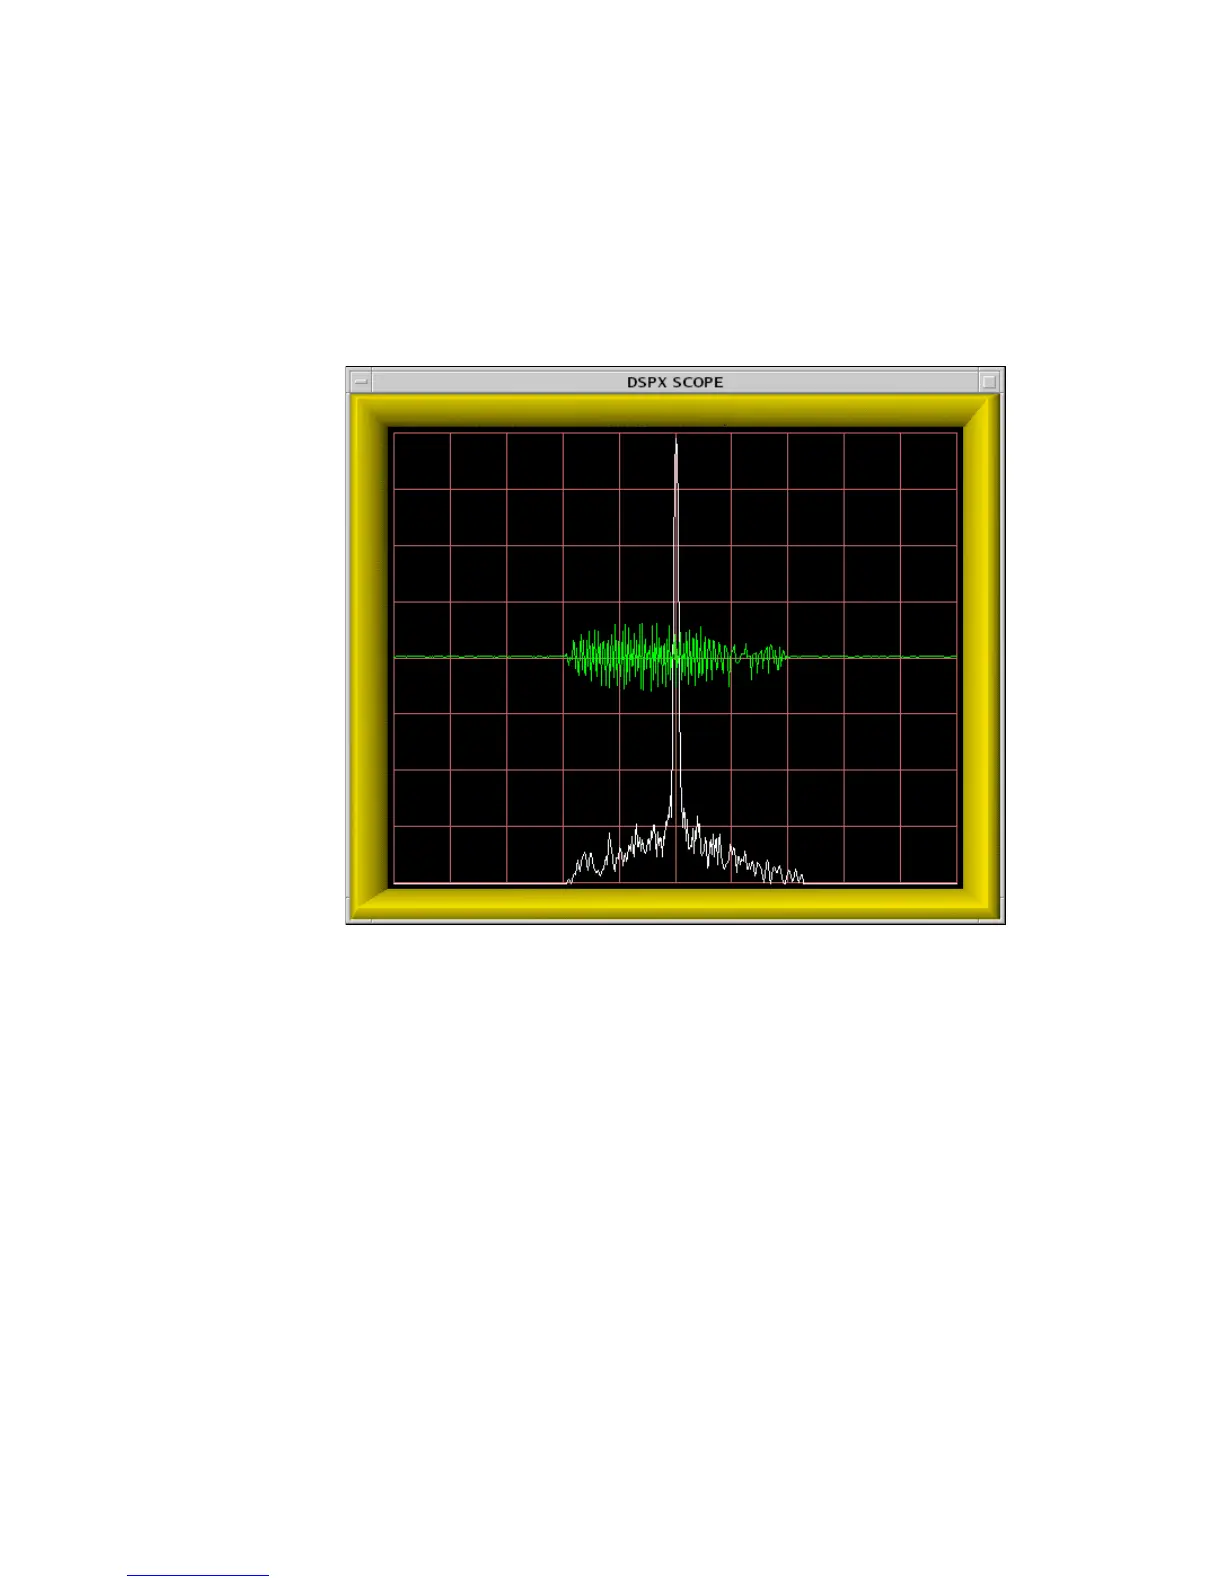
Figure 34 IFDR Sampling of Optimized Compressed Tx
Waveform
Figure 34 on page 176 shows an actual Pr plot of a 40µ sec, 5MHz
optimized waveform generated by the RVP900/Tx card and fed into the
IFDR. In this example, the ideal Tx waveform has a Peak Sidelobe Level
(PSL) of -76.7dB and an Integrated Sidelobe Level (ISL) of -62.3dB. The
measured testbench performance is several dB short of this, probably
because of the uncompensated analog band pass filters on the RVP900/Tx
and IFDR. These filters have several tenths of a dB of amplitude ripple as
well as minor deviations from linear phase within the 5MHz signal
bandwidth. The effect is that the sampled analog waveform is not quite
identical to the ideal waveform.
The Ps plotting command can also be used to examine the ideal transmit
spectrum and actual received spectrum of compressed pulses. An example
is shown in Figure 35 on page 177 below for a 60MHz, 40µ sec linear FM
 Loading...