Chapter 6 ______________________________________________________ Processing Algorithms
VAISALA______________________________________________________________________ 193
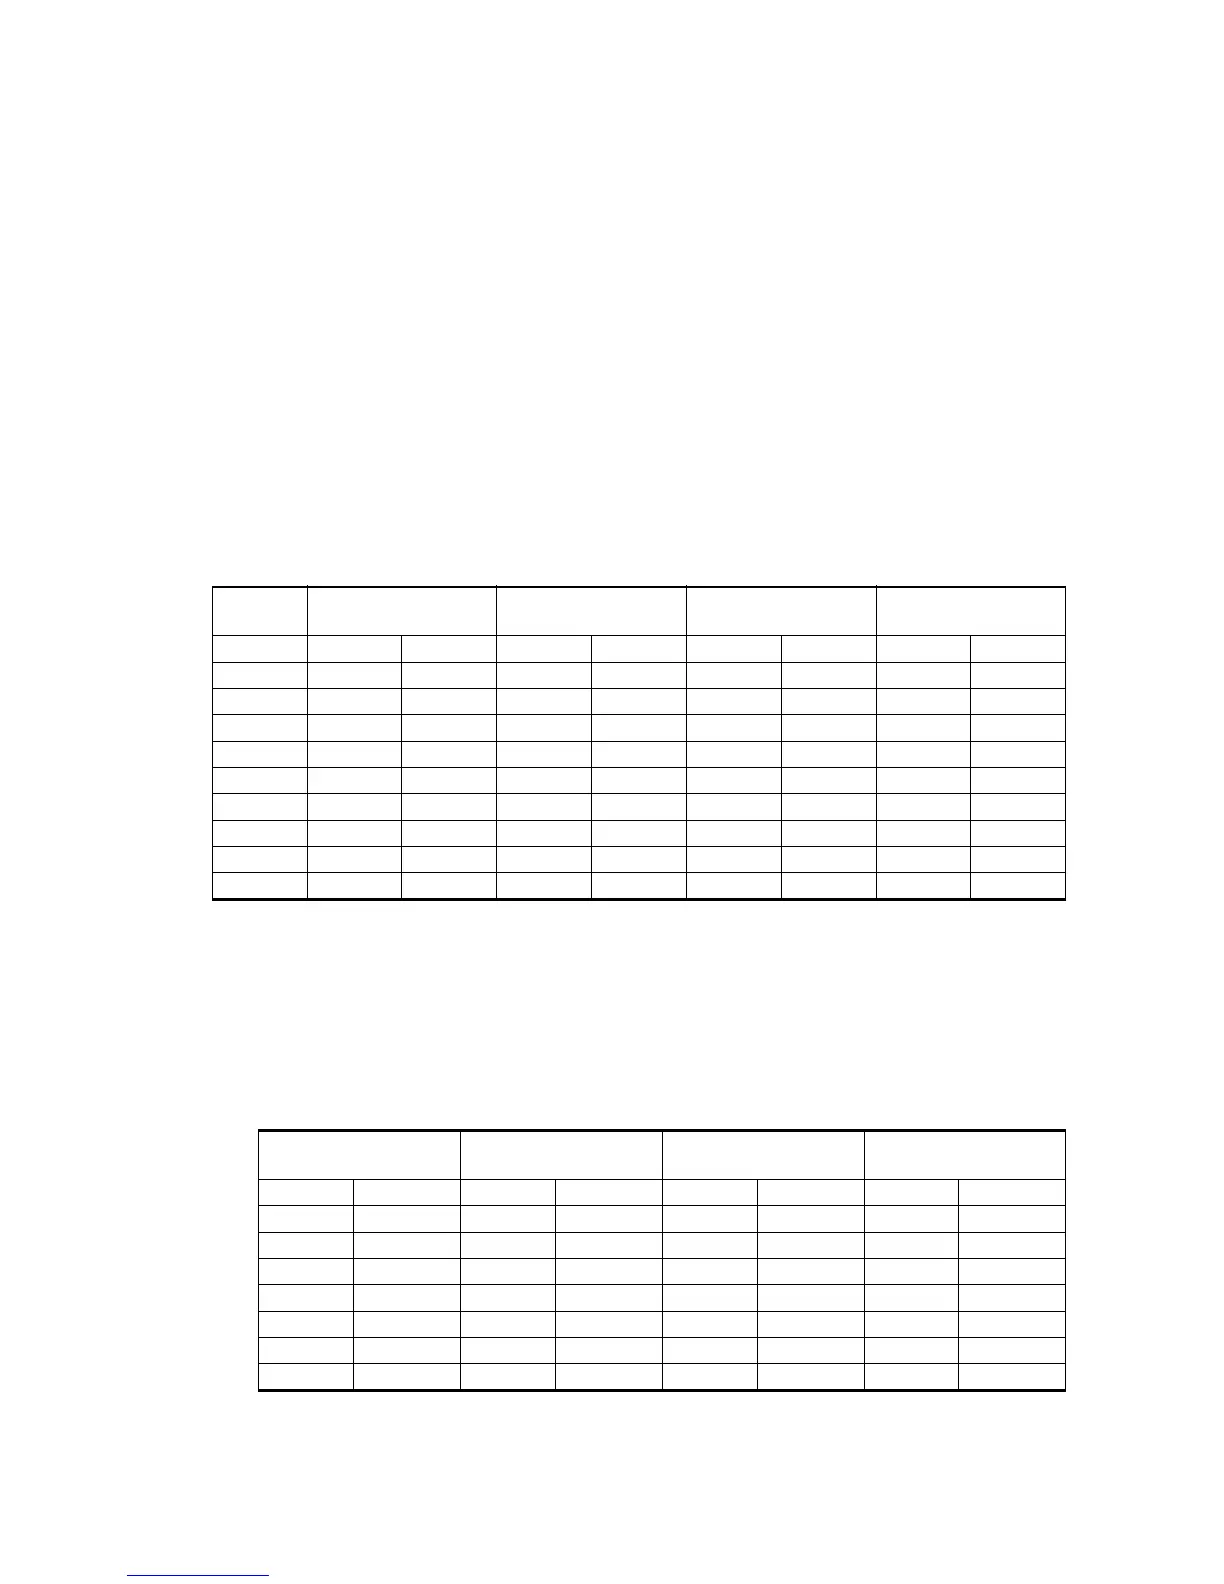
below were obtained when the algorithms were applied to realistic weather
time series having a spectrum width = 0.1 (Nyquist), SNR = +10 dB, and
an intermittent additive interference signal that was 16dB stronger than the
weather. The interference arrived in isolated single pulses with a
probability of 2%.
Performance of the three algorithms is summarized in the first three
columns of Table 10 on page 191, for which C
1
and C
2
have the common
value shown. The fourth column also uses Algorithm #3, but with the value
of C
1
raised by 2 dB. The "Missed" rate is defined as the percentage of
interference points that manage to get through the filtering process without
being removed. The "False" (false alarm) rate is the percentage of non-
interference points that are incorrectly modified when they should have
been left alone.
A false alarm in actual precipitation echo affects the values of moments
calculated at the gate of the false alarm. For example, the measured power
and estimates of reflectivity, subsequently, become slightly lower. Table
11 on page 191 maps the rates of false alarms in Table 10 on page 191 into
mean relative changes of reflectivity (in dB).
Table 10 Algorithm Results for +16 dB Interference
C1,C2
Alg.1
Missed/False
Alg.2
Missed/False
Alg.3
Missed/False
Alg.3, C1+=2 dB
Missed/False
6.0dB 17.8% 10.91% 17.8% 4.06% 17.8% 3.48% 10.3% 4.15%
8.0dB 10.5% 6.57% 10.5% 2.42% 10.4% 1.71% 6.1% 1.92%
9.0dB 8.5% 5.09% 8.5% 1.81% 8.3% 1.16% 5.4% 1.28%
10.0dB 7.3% 4.01% 7.3% 1.42% 7.5% 0.79% 5.4% 0.85%
11.0dB 8.9% 3.14% 8.9% 1.06% 8.3% 0.51% 6.5% 0.54%
12.0dB 11.6% 2.53% 11.6% 0.85% 11.3% 0.33% 9.9% 0.35%
13.0dB 17.0% 2.07% 17.0% 0.67% 16.3% 0.22% 15.3% 0.23%
14.0dB 23.5% 1.70% 23.5% 0.54% 22.4% 0.14% 21.6% 0.15%
16.0dB 39.2% 1.21% 39.2% 0.35% 39.6% 0.06% 38.9% 0.06%
20.0dB 67.3% 0.65% 67.3% 0.14% 72.5% 0.01% 72.4% 0.01%
Table 11 Impact of False Alarms on Reflectivity Estimates
Alg.1
False Bias (dB)
Alg.2
False Bias (dB)
Alg.3
False Bias (dB)
Alg.3, +2 dB
False Bias (dB)
10.91% . . 4.06% . . 3.48% . . 4.15% . .
6.57% . . 2.42% . . 1.71% 1.92% . .
5.09% . . 1.81% . . 1.16% . . 1.28% . .
4.01% . . 1.42% . . 0.79% . . 0.85% . .
3.14% . . 1.06% . . 0.51% . . 0.54% . .
2.53% . . 0.85% . . 0.33% . . 0.35% . .
2.07% . . 0.67% . . 0.22% . . 0.23% . .
1.70% . . 0.54% . . 0.14% . . 0.15% . .
 Loading...