1-12
IM AQ1210-01EN
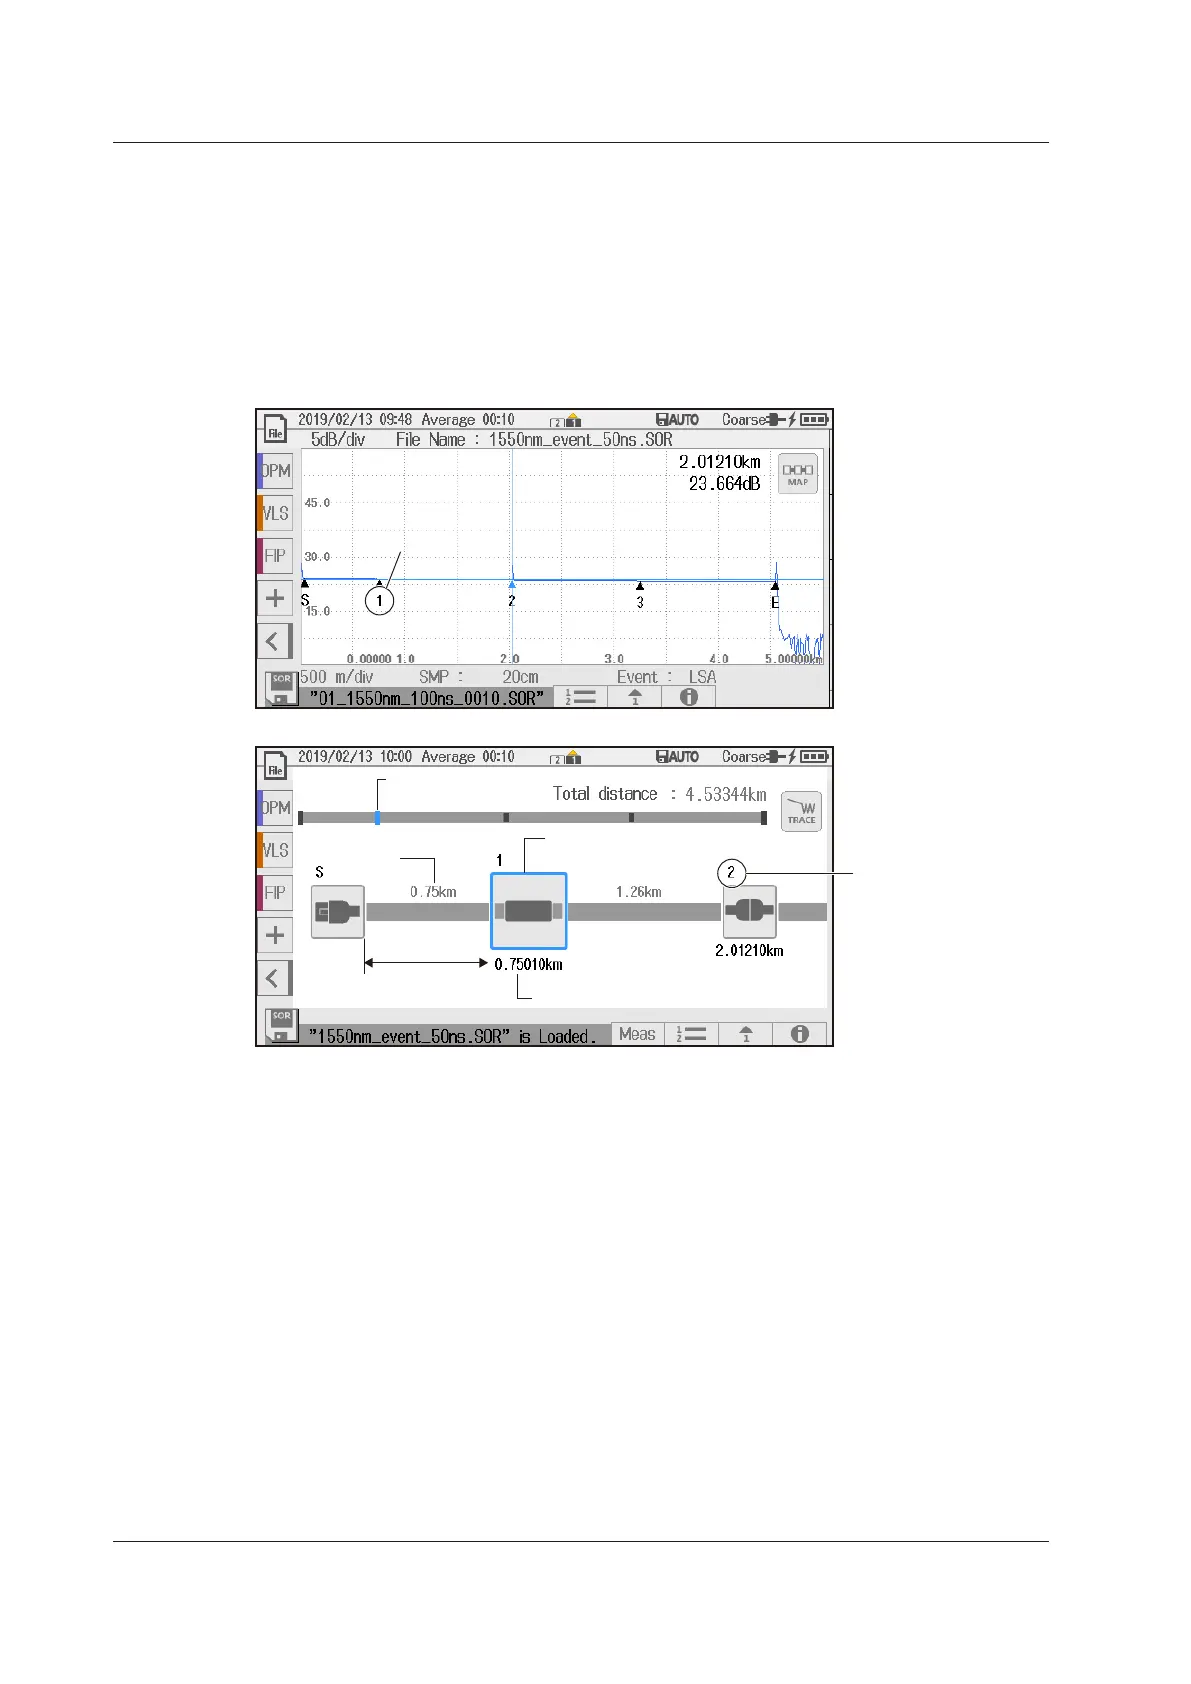
Event Analysis
All events are automatically detected from the waveform of optical pulse measurement, and the types
of each event and analysis results (splice loss, return loss, etc.) are displayed on the screen.
Event Display
In TRACE mode, detected events are displayed on the measured waveform. In MAP mode, the
types of events are displayed using icons along with the distances of each from the measurement
start position.
MAP mode
Event number
Displays the event
type with an icon
Event number
Distance between
events
Distance from start point S
Relative position of the event
1.4 Analyzing Measured Data
 Loading...