Technical Information DFS 700 / 04.2009 8-7
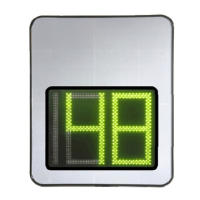
“Speed stats over daytime bins” button
This chart shows the maximum speed, the mean speed, and the n-th percentile speed (e.g.
v85%) over time-of-day for the selected reporting period. The time interval and desired
percentile are defined in the "Data report" window (Figure 8-4).
Figure 8-8 Speed stats over daytime bins
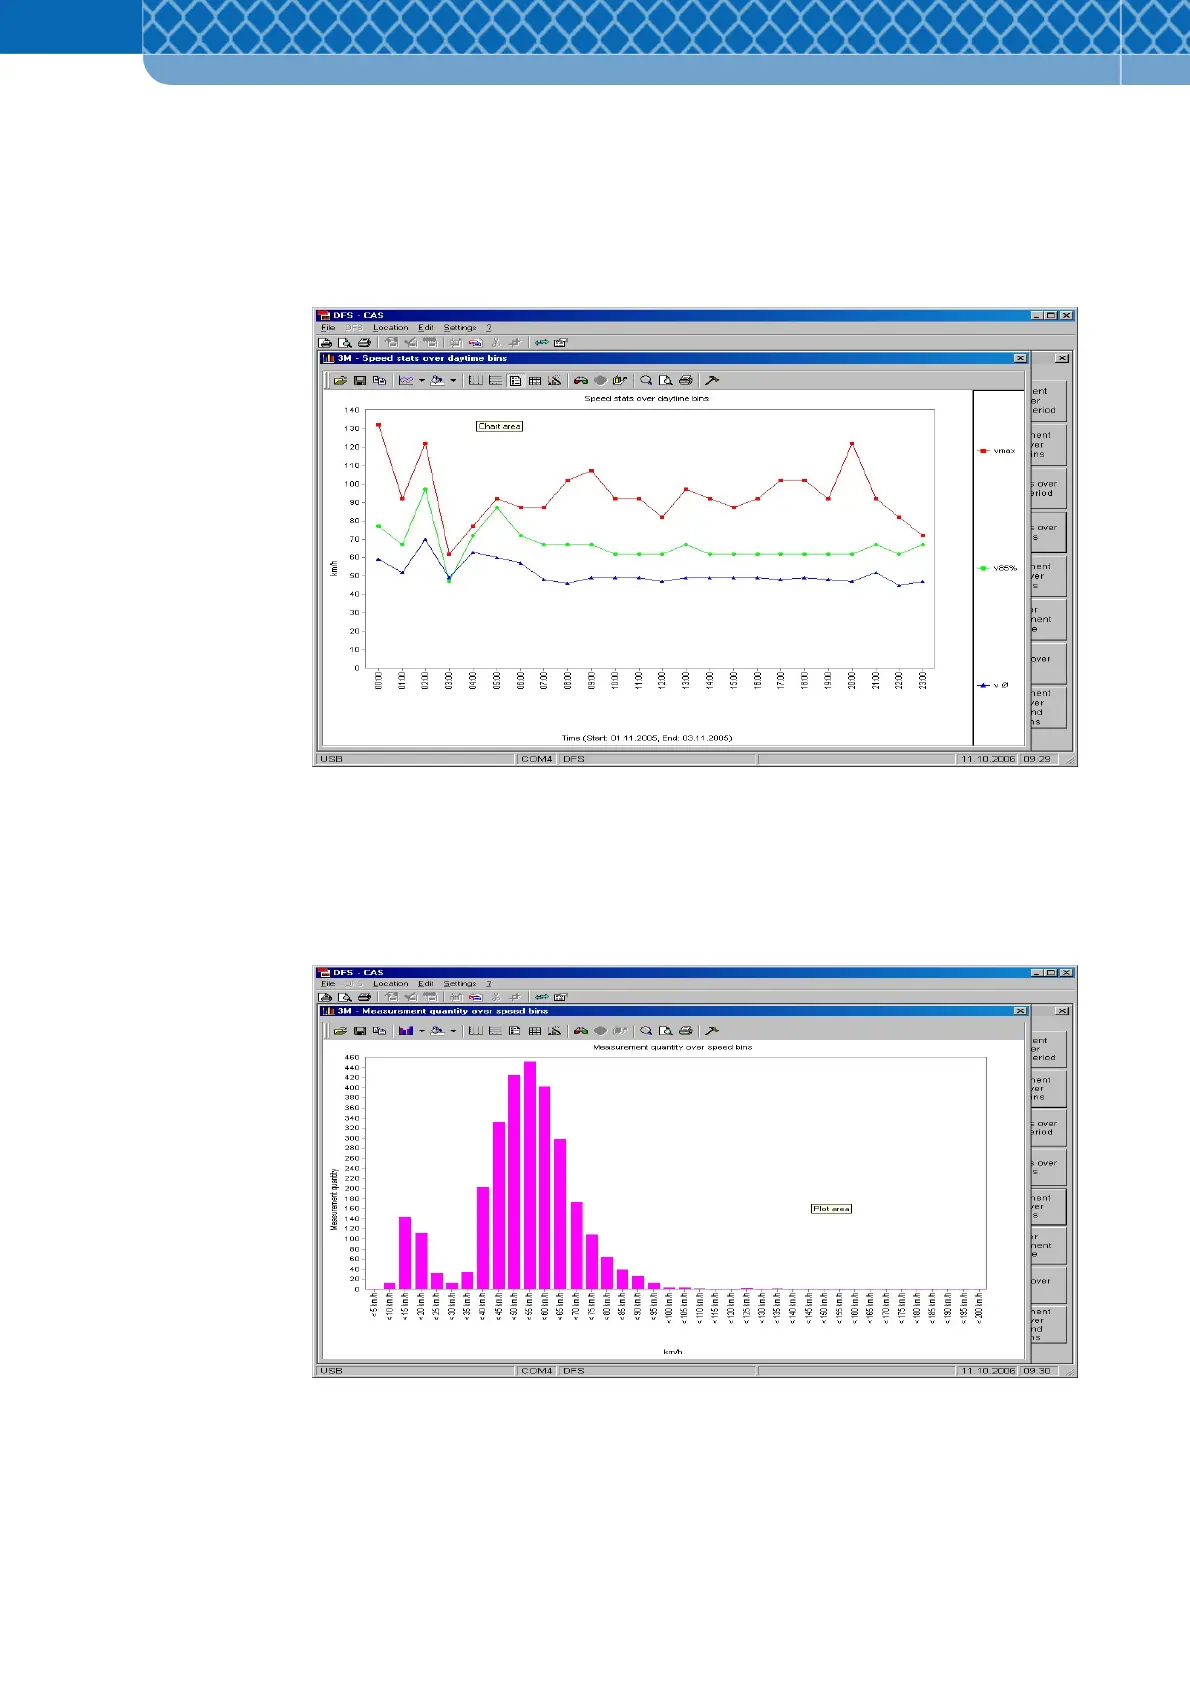
“Measurement quantity over speed bins” button
This chart shows the number of measurements relative to speed intervals for the selected
reporting period. The speed interval is preset in the "Data report" window (Figure 8-4).
Figure 8-9 Measurement quantity over speed bins