Technical Information DFS 700 / 04.2009 8-6
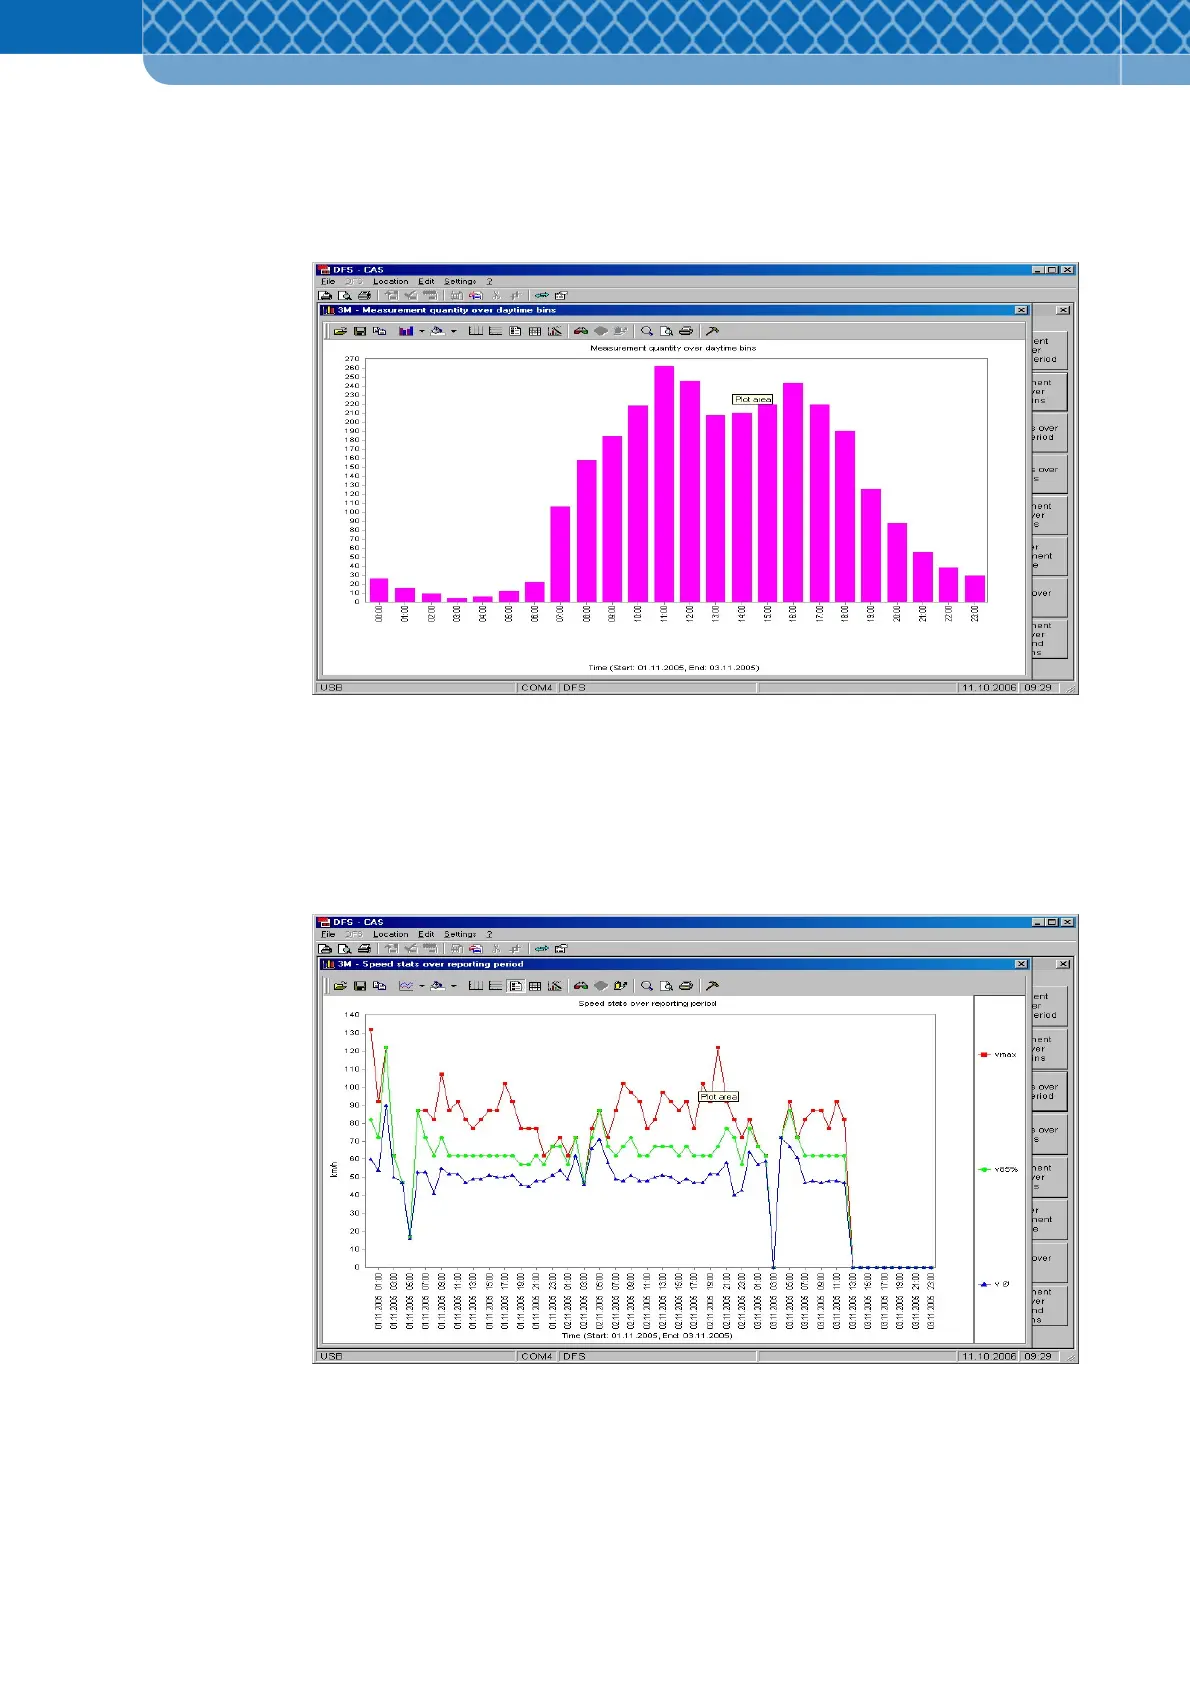
“Measurement quantity over daytime bins” button
This chart shows the number of measurements over time-of-day for the selected reporting
period. The time interval is specified in the "Data report" window (Figure 8-4).
Figure 8-6 Measurement quantity over daytime bins
“Speed stats over reporting period” button
This chart shows the maximum speed, the mean speed, and the n-th percentile speed (e.g.
v85%) over time for the selected reporting period. The time interval is defined in the "Data
report" window (Figure 8-4).
Figure 8-7 Speed stats over reporting period