15
Installation, Operation & Maintenance Manual
OXYvisor Optical Oxygen Analyzer
The OXYvisor analyzer uses a quench uorescence technique with a sensor optically isolated from the
process, using the absorbency as a diagnostic function and analyzing the phase angle for measurement of the
analyte, oxygen, in the modulated time domain. This gives the analyzer the ability to measure accurately and
precisely under various and changing ambient and process conditions.
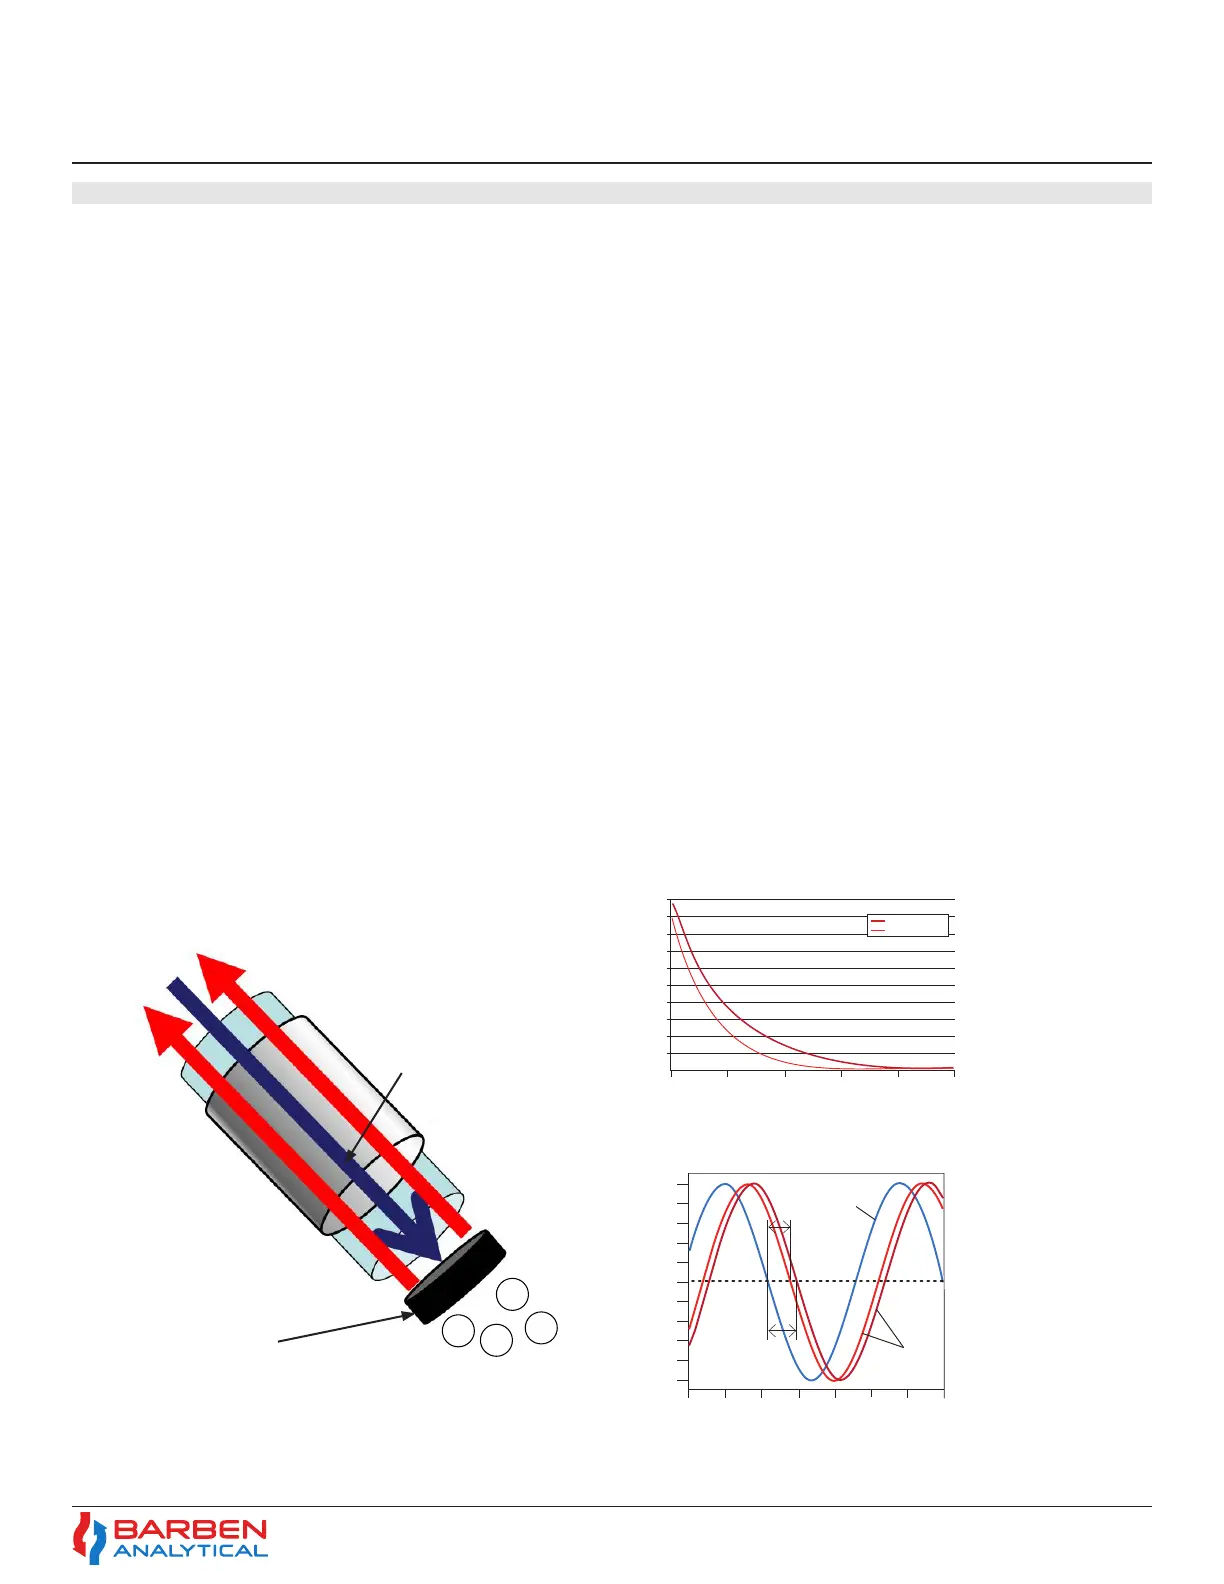
The analyzer uses an LED to emit blue light through ber optic cable down to the luminophore which resides
at the sensor tip [Fig 1]. The luminophore absorbs the energy and rises to an excited state indicated by red
light returned back through the ber optic cable. The properties of the emitted light are measured through a
photomultiplier tube back at the spectrometer within the analyzer.
In the absence of oxygen, the excited luminophore will fall back to its ground state at a specic intensity
and phase angle. When oxygen is present it quenches the uorescence at a lower rate proportional to the
oxygen concentration [Fig 2.]. The phase shift and intensity dierences between the excitation source and the
uorescent signal is measured and the oxygen concentration is calculated [Fig 3].
The resulting measurement is specic to oxygen concentration. The luminophore is unaected by other
constituent gases and ow rate. The measurement is applicable in both gas and liquid phase. Temperature
compensation is required to account for quenching eciency at dierent temperatures and pressure
compensation is required to measure at process pressured dierent than the pressure at time of calibration.
O
2
O
2
O
2
O
2
Fiber optics transmits light
and receives emitted light
back from the luminophore
Oxygen sensitive luminophore
exposed to the process liquid
Figure 1 - Light Transmission
Figure 2 - O
2
Quenching Intensity vs Time
Figure 3 - O
2
Quenching AC Modulation
1.0
0.9
0.8
0.7
0.6
0.5
0.4
0.3
0.2
0.1
0
Intensity
-5 0 5 10 15 20 25 30
Time (µseconds)
ϕ
1
ϕ
2
reference
signal
measuring
signal
1.0
0.9
0.8
0.7
0.6
0.5
0.4
0.3
0.2
0.1
0
Intensity
0 5 10 15 20 25
Time (µseconds)
0% Oxygen
100 ppm Oxygen
Effects of 100 ppm oxygen quenching
The eect of O2
quenching on light
intensity from the
luminophore sensor is
shown above. Light
emitted from the
excited luminophore
has higher intensity
over a longer period
than when oxygen is
present. The intensity
and time are measured
by the spectrometer
withing the OXYvisor
to provide an oxygen
measurement.
AC modulation of the
blue light results in a
similar waveform of the
emitted red light from
the luminophore sensor.
The presence of oxygen
causes a phase shift
between Փ1 and Փ2 of
the red light waveform.
Measurement of
this phase shift
proportionally matches
the loss of intensity
shown in Fig 2 above.
The combination of
both measurement
techniques provides a
stable, accurate method
to measure oxygen in
liquid and gas phase
applications.
Light transmission through ber optic to luminophore
AC modulation and the phase shifted output
2.5 General principle of operaon
Section 2
Technical Product Specication