47
Installation, Operation & Maintenance Manual
OXYvisor Optical Oxygen Analyzer
2
˗
˗
˗
˗
˗
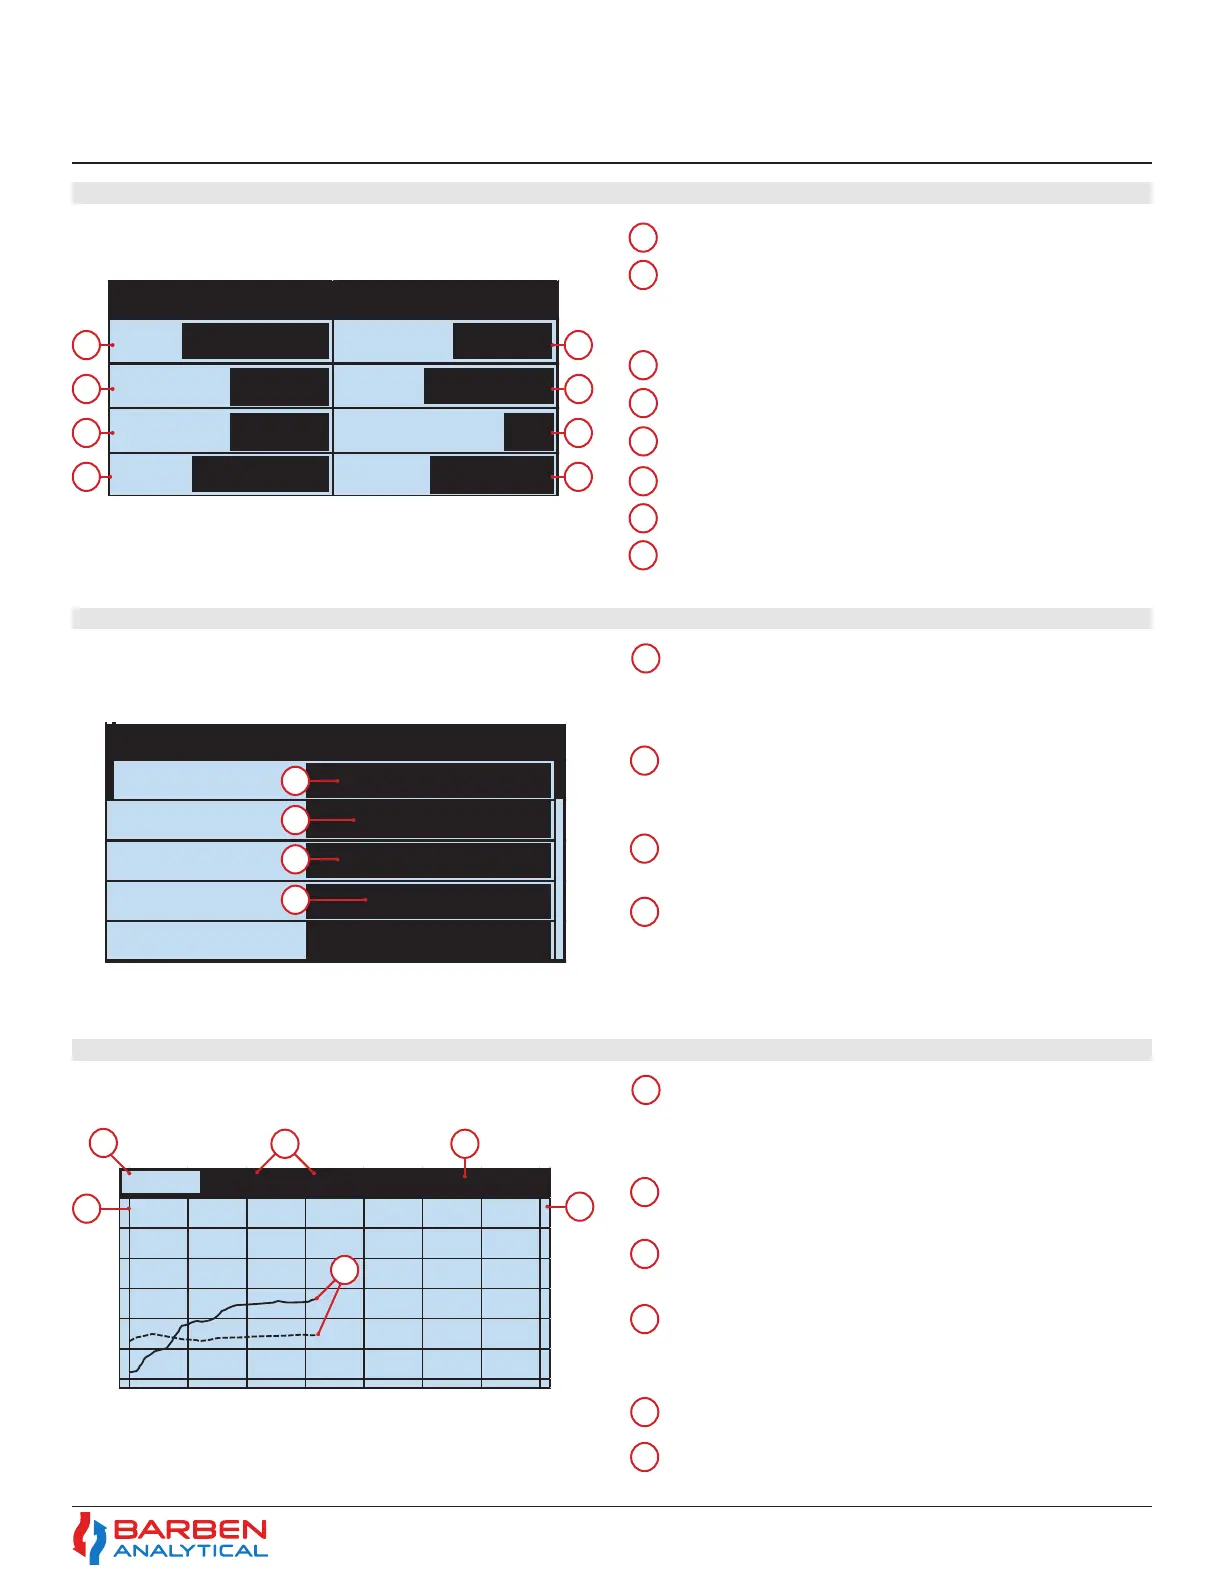
20.948 % O
2
67.9°F 3h 50m 21s
O2 & Temp
5. Relay Out2
Open (Cal)
Oxygen measurement value
Analog Out 1 - Indicates the AO1 mA output for
the related PV. This example shows, 17.49 mA for
Oxygen.
PV’s vs time - Using the up and down arrows you
can select a combination of dierent PV’s vs time to
be graphed. Example show O
2
and Temp
Pressure - Measured and Compensated
Relay Out 1 - Show Status of the Relay as Open/
Closed. This example shows an Open (cal) which
indicates relay is not active, and is dedicated to
AutoCal.
Measured Values of PV1 and PV2 - Shows the current
measured values of the selected parameters.
Temperature- Measured and Compensated
Analog In - Shows the measured mA input from the
Temperature or Pressure transmitter.
PV2 Scale - This shows the PV, value and unit for
the right Y axis of plot (dashed line).
Plot Time - Amount of time shown on graph
Phase Angle - Measured Phase Angle
Amplitude - Indicates Signal Strength
Error - Will show any error value.
Time - via the 24 Hour Clock
5.7 Alternave Main Display Details - Funcons and Use
5.8 Main Input / Output Display - Funcons and Use
5.9 Main Trend Display - Funcons and Use
7
8
3
3
3
5
3
3
4
4
4
4
4
6
5
5
6
1
1
1
Sample Rate - The current user selected
Sample Rate. This programmable rate
determines how often the measurement is taken.
2
Analog Out 2 - Indicates the AO2 mA output for
the related PV. This example shows, 0.0 mA for
N.A. (Not applicable) for a channel not set up.
PV1 Scale - This shows the PV, value and unit
for the left Y axis of plot (solid line).
PV’s vs Time - The solid line is PV1 (left Y axis)
and dashed is PV2 (right Y axis)
2
2
6
2
2
Oxy Phase
Sample Amp
Temp Error
Pres T ime
20.948 %O2
29.34
3
4
5
6
7
8
1
2
1
1
Section 5
Operations