39
Overview of shots and PIR activity on a map
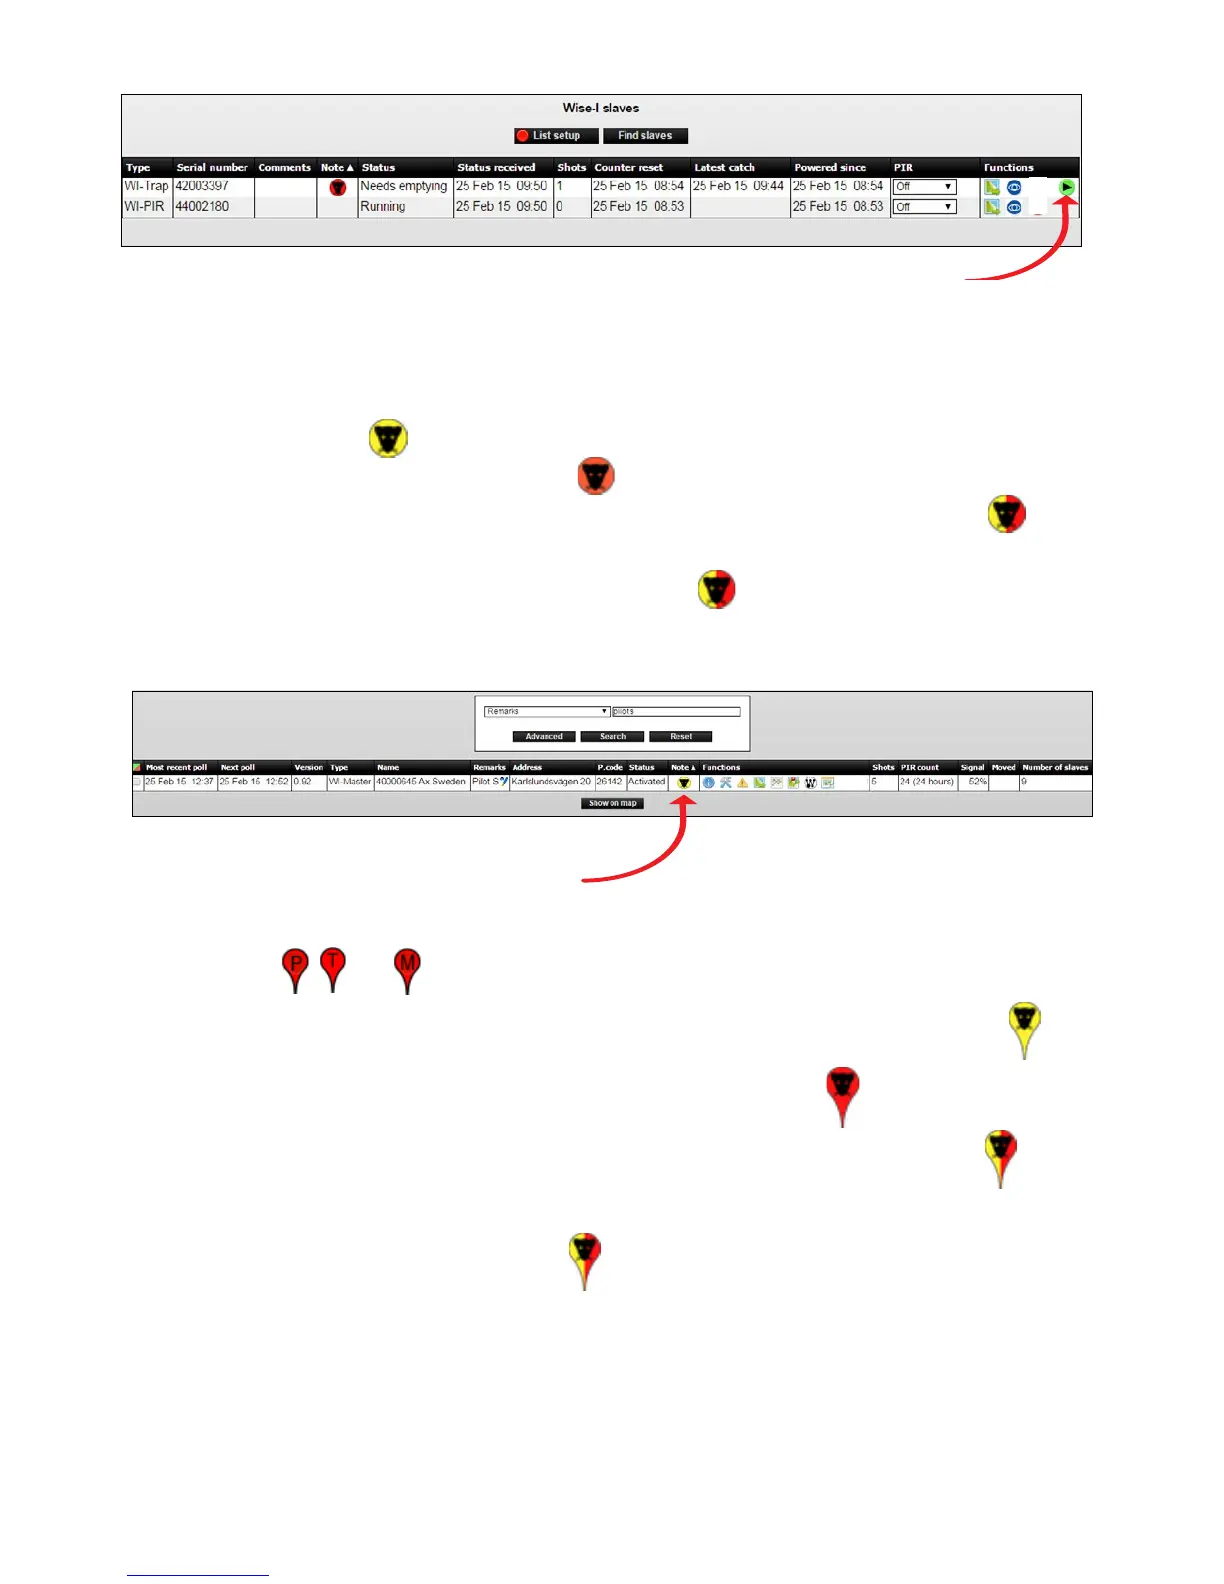
1. The trap list shows the number of shots (kills) and PIR activity. PIR activity is displayed as a
yellow rat head
in the Note column (can be both Smart Eye and Smart Catch).
Shots are displayed as a red rat head
in the Note column (can only be Smart Catch).
Traps with both a kill and PIR registration are displayed as a yellow / red rat head
in the
Note column. Smart Eye
On Box mode register activity in traditional bait and spring trap
boxes and is displayed with a red /yellow rat head
in the Note column.
2. Press on the rat head icon to see on a map, where activity and shots are registered.
3. The map shows all Smart Catch and Smart Eye and Smart Connect.
Smart Connect devices with no activity, as well as the Smart Connect appear as regular
drops
, and .
Smart Catch and Smart Eye with registered PIR activity appear as yellow rat heads
.
Smart Catch with a catch (shot) is displayed with a red rat head
.
Smart Catch with both catch and PIR activity appear with a yellow / red rat head
.
Smart Eye On Box mode register activity in traditional bait and spring trap boxes are
displayed with a red /yellow rat head
.
In On Box mode you may have a kill or a registration depending on whether there is poison
or a spring trap inside the box.
4. This provides an overview of where there is activity, and where there is a need to empty
traps.