54
Statistics
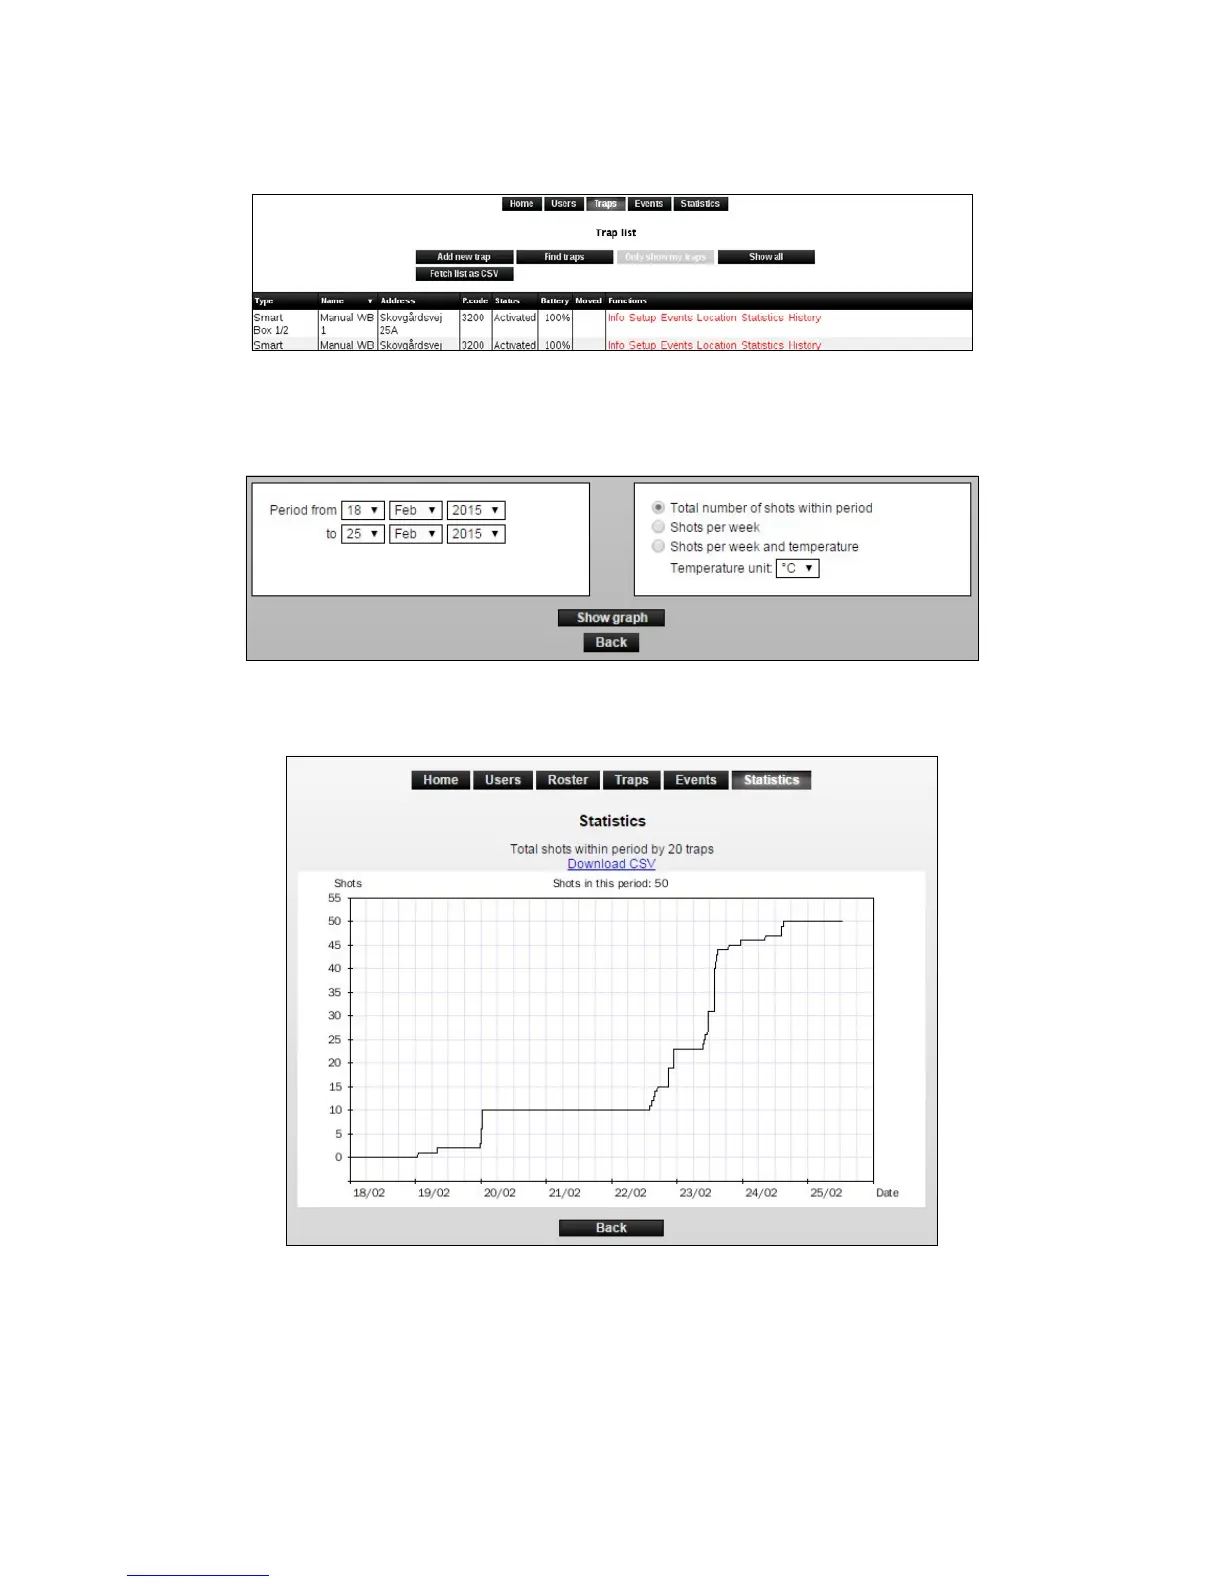
1. Click on [Statistics] in the trap list on the desired Smart Connect (Smart Connect system).
2. It is possible to get a graph of the number of shots (killed mice and rats) that have been in a
Smart Connect system in a given period. Choose a period to see the desired statistics.
3. Choose the information you want the statistics/graph to include. Click on [Show graph].
4. It is also possible to export statistics and graphs to Excel, click on [Download as CSV] and
savethele.