Manual, F/T Sensor, Data Acquisition (DAQ) Systems
Document #9620-05-DAQ.indd-20
Pinnacle Park • 1031 Goodworth Drive • Apex, NC 27539 • Tel: 919.772.0115 • Fax: 919.772.8259 • www.ati-ia.com • Email: info@ati-ia.com
56
5. Operation
5.1 Writing DAQ F/T Application
See the ATI DAQ FT help le for information on developing your own application.
5.2 Data Collection Rates
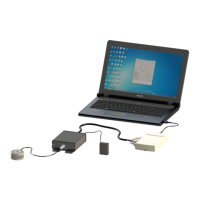
Our DAQ F/T sensor systems are designed to be electrically compatible with most commercially-available,
general-purpose and high-accuracy data acquisition hardware. For best performance in all applications,
the transducer electronics have bandwidth of 5kHz to 10kHz (depending on gain settings). This allows
collection of all transducer frequency content. Note: that to satisfy the Nyquist Theorem†, the data needs
to be coupled at a rate greater than twice the highest frequency present, even if data at that frequency is not
preferred.
Note: that signicant error can be introduced in the transducer data if a National Instruments E-Series card
is sampling each data set at over 40 kHz (240 kHz per channel). Users with fast NI-DAQ devices should not
use the single-scan functions of NI-DAQ, such as AI_Read_Scan and AI-VRead_Scan. A buffered operation
(such as Scan_Op) should be used instead. In the ATI DAQ FT Demo, the Buffer Mode option should be
enabled.
† The Nyquist Theorem applies to data collection and states that data acquired must be collected at a data
rate greater than twice the highest frequency present in the data, otherwise the data will be erroneous.
5.3 Multiple Calibrations
Some transducers have multiple calibrations, to allow the transducer to have greater range or ner
resolution, depending on the circumstance. Changing to another calibration is done by loading the new
calibration in the demo software; select the File/Open Calibration menu or update the CalFilePath property
in your application.
5.4 Resolution
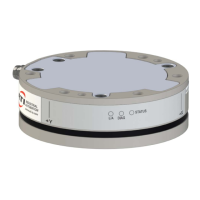
ATI’s transducers have a three sensing beam congurations where the three beams are equally spaced
around a central hub and attached to the outside wall of the transducer. This design transfers applied loads
to multiple sensing beams allowing the transducer to increase its sensing range in a given axis provided
a counterpart axis has reduced loading (see 9620-05-Transducer Section—Installation, Operation, and
Specication Manual for compound loading information).
The resolution of each transducer axis depends on how the applied load is spread among the sensing beams.
The best resolution occurs when quantization of the gages is evenly distributed as load is applied. In the
worst case scenario, the discrete value of all involved gages increases at the same time. The typical scenario
will be somewhere in between these two.
F/T resolutions are specied as typical resolution, dened as the average of the worst and best case
scenarios. Because both multi-gage effects can be modeled as a normal distribution, this value represents
the most commonly perceived average resolution. The DAQ F/T resolutions are based on real-number
calculations and do not result in clean fractions. To express the values as clean fractions, the values that a
16-bit DAQ card can achieve will have to be used. The yielded values are a conservative estimation of the
transducer’s actual performance.
 Loading...