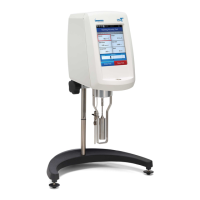
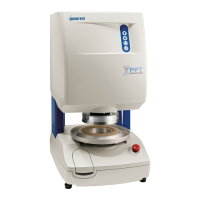
Brookeld Engineering Labs., Inc. Page 25 Manual No. M13-167
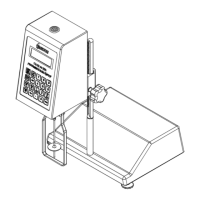
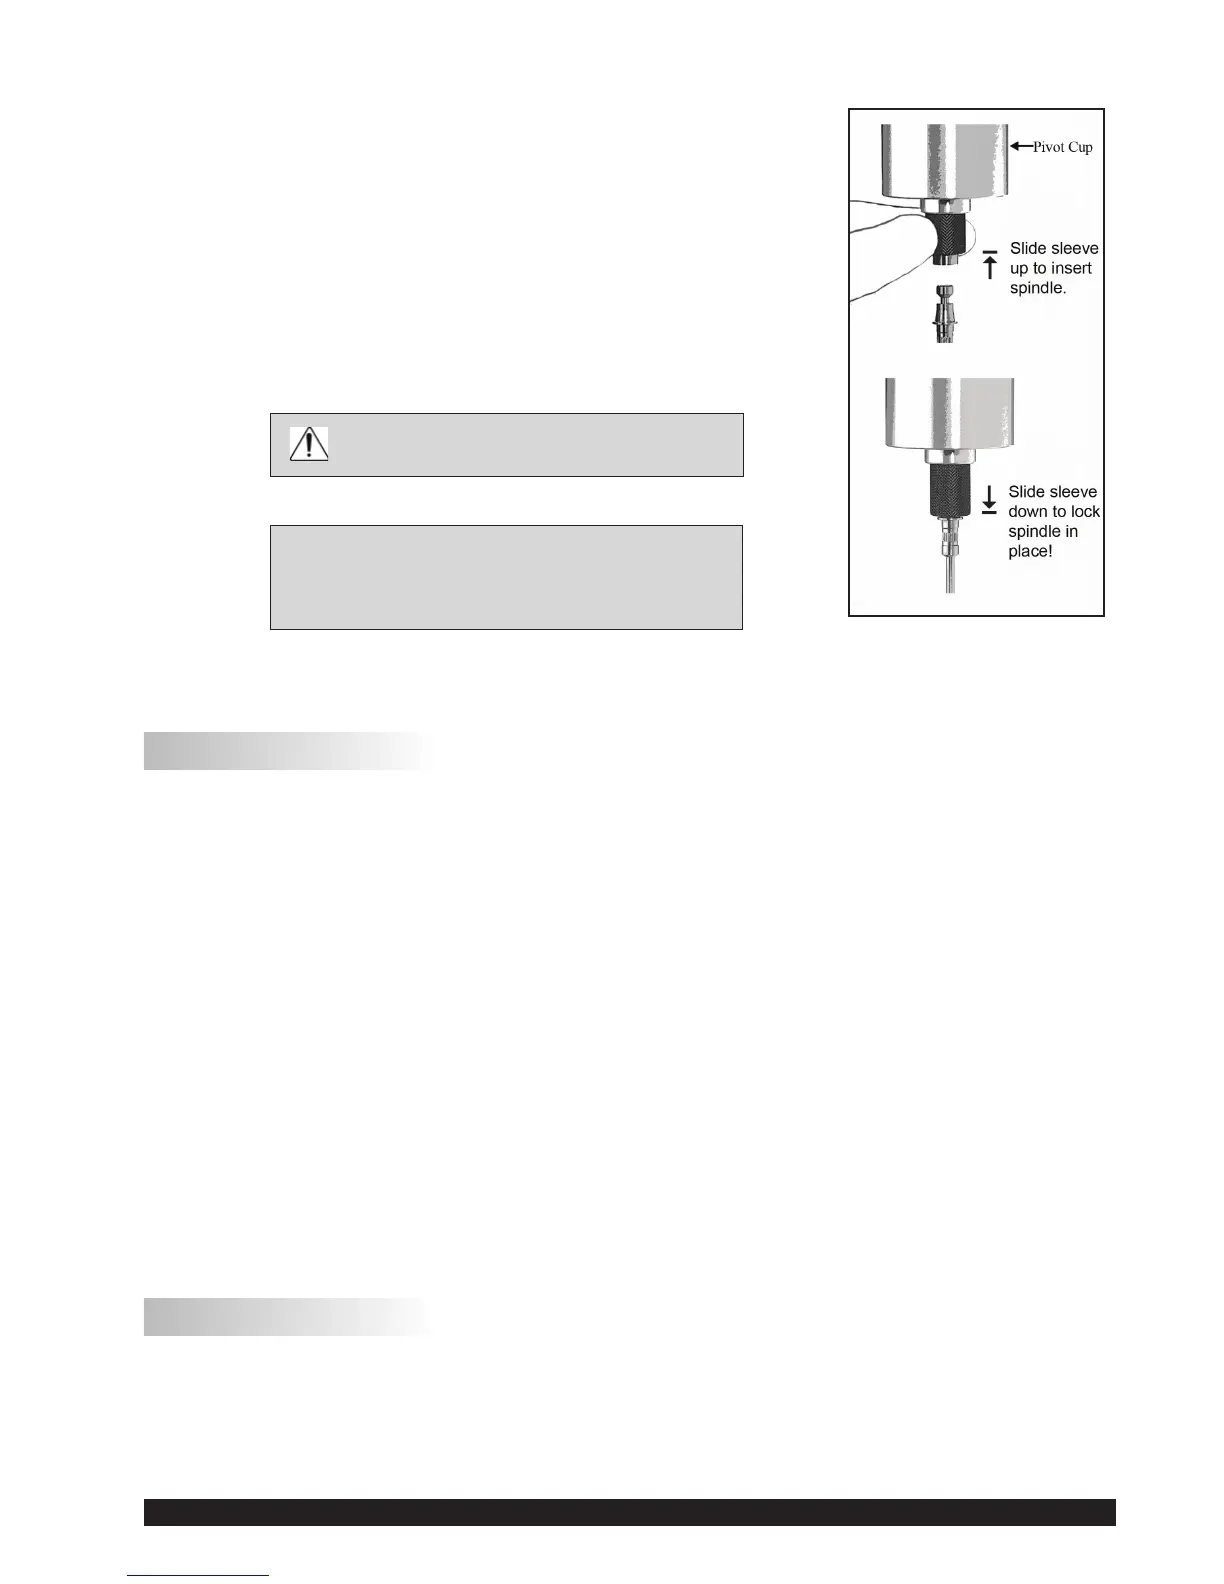
IfyourinstrumenthastheEZ-Locksystem,thespindlesareattached
as follows:
With one hand hold the spindle, while gently raising the spring-
loadedoutersleevetoitshighestpositionwiththeotherhand,as
shown in Figure III-2. Insert the EZ-Lock Spindle Coupling so
thatthebottomofthecouplingisushwiththebottomoftheshaft,
andlowerthesleeve.Thesleeveshouldeasilyslidebackdownto
holdthespindle/couplingassemblyinplaceforuse.[Spindlescan
beidentiedbyentrycode;lookforthenumberonthesideofthe
EZ-Lockspindlecoupling.]
ThemotorshouldbeOFF whenever
spindlesarebeingremovedorattached.
Note: KeeptheEZ-LockSpindleCouplingand
outer sleeve as clean as possible and free
from debris that could become lodged
insidetheadapter.
III.4 Multiple Data Points
Themajorityofviscosityandyieldstressmeasurementsaremadeatthequalitycontrolleveland
oftenconsistofasingledatapoint.Thetestisconductedwithonespindleatonespeed.Thedata
pointisausefulbenchmarkforthego/no-godecisioninaproductionsetting.TheDV2Tcanbe
used for single point measurement.
Manyuidsexhibitacharacteristicchangeinviscosityandyieldstresswithachangeinapplied
force.Thisnon-Newtonianowbehavioriscommonlyseeninpaints,coatingsandfoodproducts
asadecreaseinviscosityasshearrateincreasesoranincreaseinyieldstressasarotationalspeed
increases.Thisbehaviorcannotbedetectedorevaluatedwiththesinglepointmeasurement.
Non-Newtonianowisanalyzedthroughthecollectionofviscositydataoverarangeofshearrates
andthegenerationofagraphofviscosityversusshearrate(arheogram).Thisinformationwill
allowforamorecompletecharacterizationofauidandmayhelpinformulationandproduction
ofaproduct.TheDV2Tiscapableofcollectingmultipledatapointsforcomprehensiveanalysis
ofowbehaviorwhenusingtestprogramscreatedwithPGFlashSoftware(seeSectionV).
Moreinformationonowbehavior,shearrateandrheogramsisavailableinourpublication,“More
SolutionstoStickyProblems”.
III.5 Selecting Data Collection
TheDV2TViscometeroffersseveraloptionsfordatacollection.TheDataCollectionsettingis
showninCongureViscosityTestdirectlyundertheTemperaturedisplay.Thefactorysettingis
SinglePoint(seeFigureIII-3).Pressingthebluearrow,inthiseld,willpresenttheDataCollection
screen(seeFigureIII-4).
Figure III-2