CHAPTER 4: USING THE DEVICE
MANAGEMENT INTERFACE
PAGE 4-71
Session Time
(hh:mm:ss)
(Subscriber
Module Mode)
This timer indicates the time elapsed since the Subscriber Module registered to
the Access Point.
Wireless Security
(Subscriber
Module Mode)
This field indicates the security state of the Access Point to Subscriber Module
link.
Meets Reg Criteria
(Subscriber
Module Mode)
Yes: The scanned Access Point meets the Network Entry criteria defined by the
internal Network Algorithm.
No: The scanned Access Point does not meet the Network Entry criteria defined
by the internal Network Algorithm.
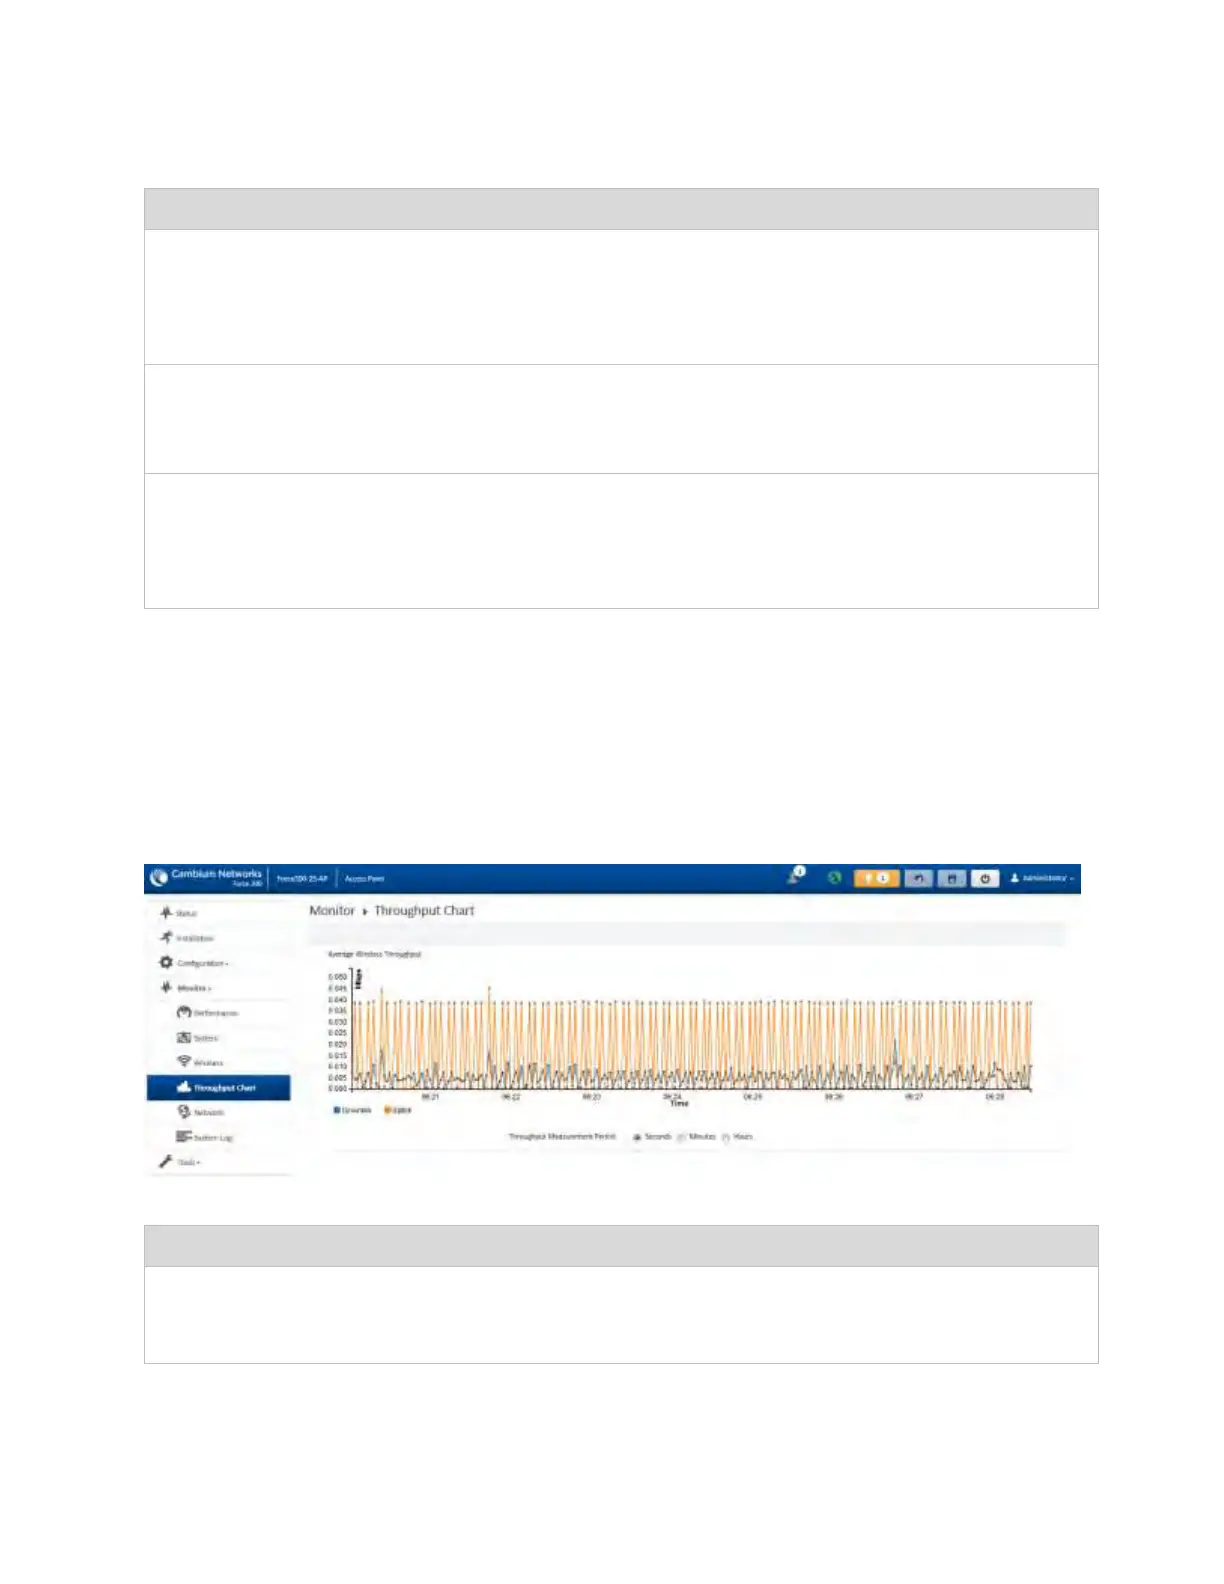
Monitor > Throughput Chart page
Use the Throughput Chart page to reference a line chart visual representation of system throughput
over time. The blue line indicates downlink throughput and the orange line indicates uplink throughput.
The X-axis may be configured to display data over seconds, minutes, or hours, and the Y-axis is adjusted
automatically based on average throughput. Hover over data points to display details.
Figure 25 Monitor > Throughput Chart page
Table 47 Monitor > Throughput Chart page attributes
Throughput
Measurement
Period
Adjust the X-axis to display throughput intervals in seconds, minutes, or hours
 Loading...