4.3.- DISPLAY
The device has a backlit LCD display showing all the parameters listed in
Table 3.
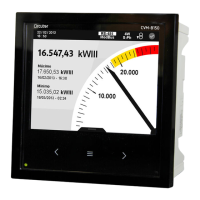
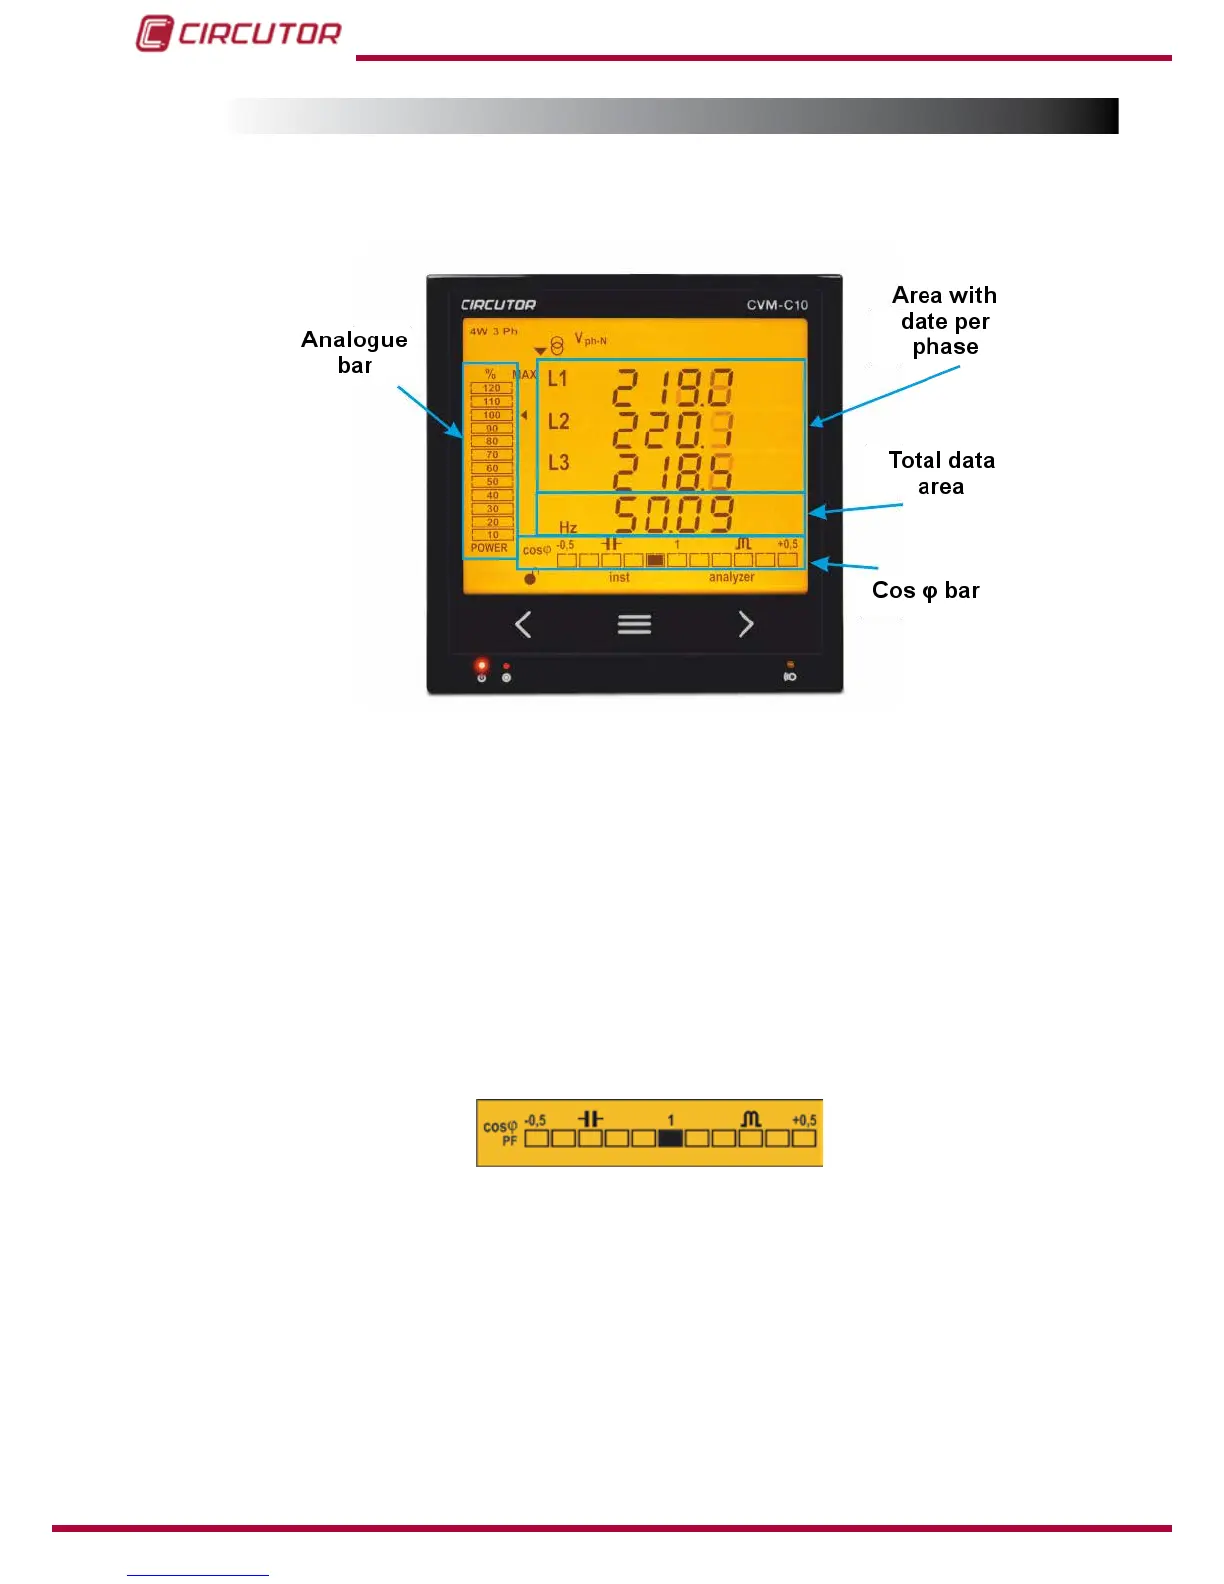
The display is divided into four areas (Figure 22):
Figure 22: CVM-C10 Display areas
The area with data per phase displays the instantaneous, maximum and minimum
values of each phase being measured or calculated by the device.
The total data area displays the totals of the values being measured or calculated by
the device.
Analogue bar, displays the % of the current power of the installation.
Cos φ - PF Bar, displays the value of the system's Cos φ or power factor in real time.
4.3.1. cos φ - PF (POWER FACTOR) BAR
Figure 23: Cos φ - PF Bar
This bar displays the value of the installation's cos φ or power factor in real time.
The parameter that will be displayed is selected on the programming menu. (
“4.9.14. Selecting
the Cos φ - PF bar on the display”
)
Note : This bar will not be displayed in the IEC and IEEE measurement conventions.
34