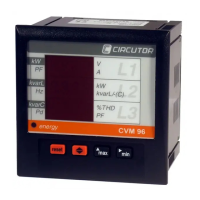
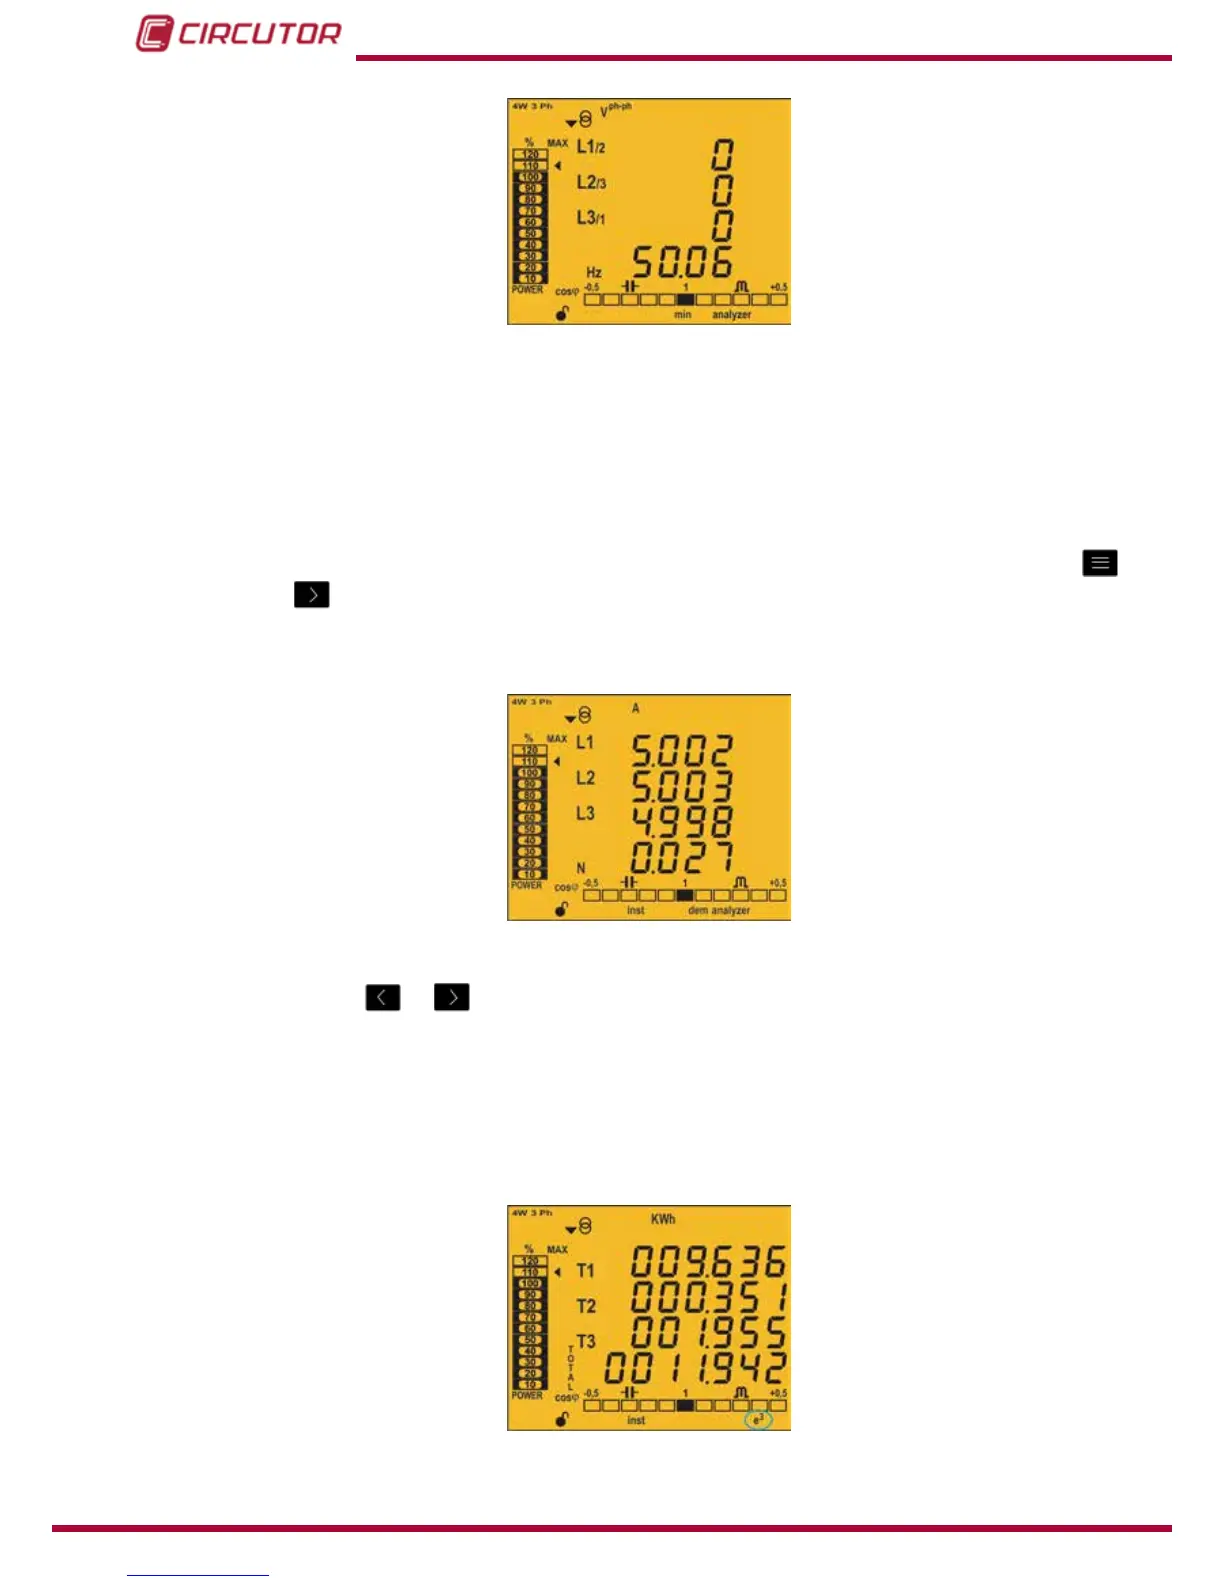
Figure 28: Analyzer prole screen displaying the minimum values.
Maximum Demand
The device calculates the maximum demand of the following:
• Current
• Three-Phase Active Power.
•Three-Phase Apparent Power.
This value can be displayed on the display screen of the parameter by pressing the
and
keys at the same time.
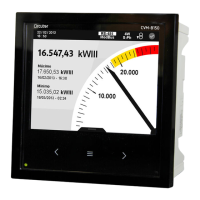
The dem symbol appears on the display (Figure 29)
Figure 29: Analyzer prole screen displaying the maximum demand values.
Press keys
or to stop displaying the maximum demand values.
The maximum demand values are reset on the programming menu:
“4.9.11. Deleting maximum demand”
4.5.2. e
3
PROFILE
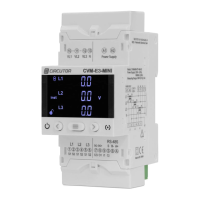
This prole is identied with the e
3
symbol on the bottom of the screen (Figure 30).
Figure 30: CVM-C10 screen with the e
3
prole.
40