xStack® DES-3200 Series Layer 2 Managed Fast Ethernet Switch
265
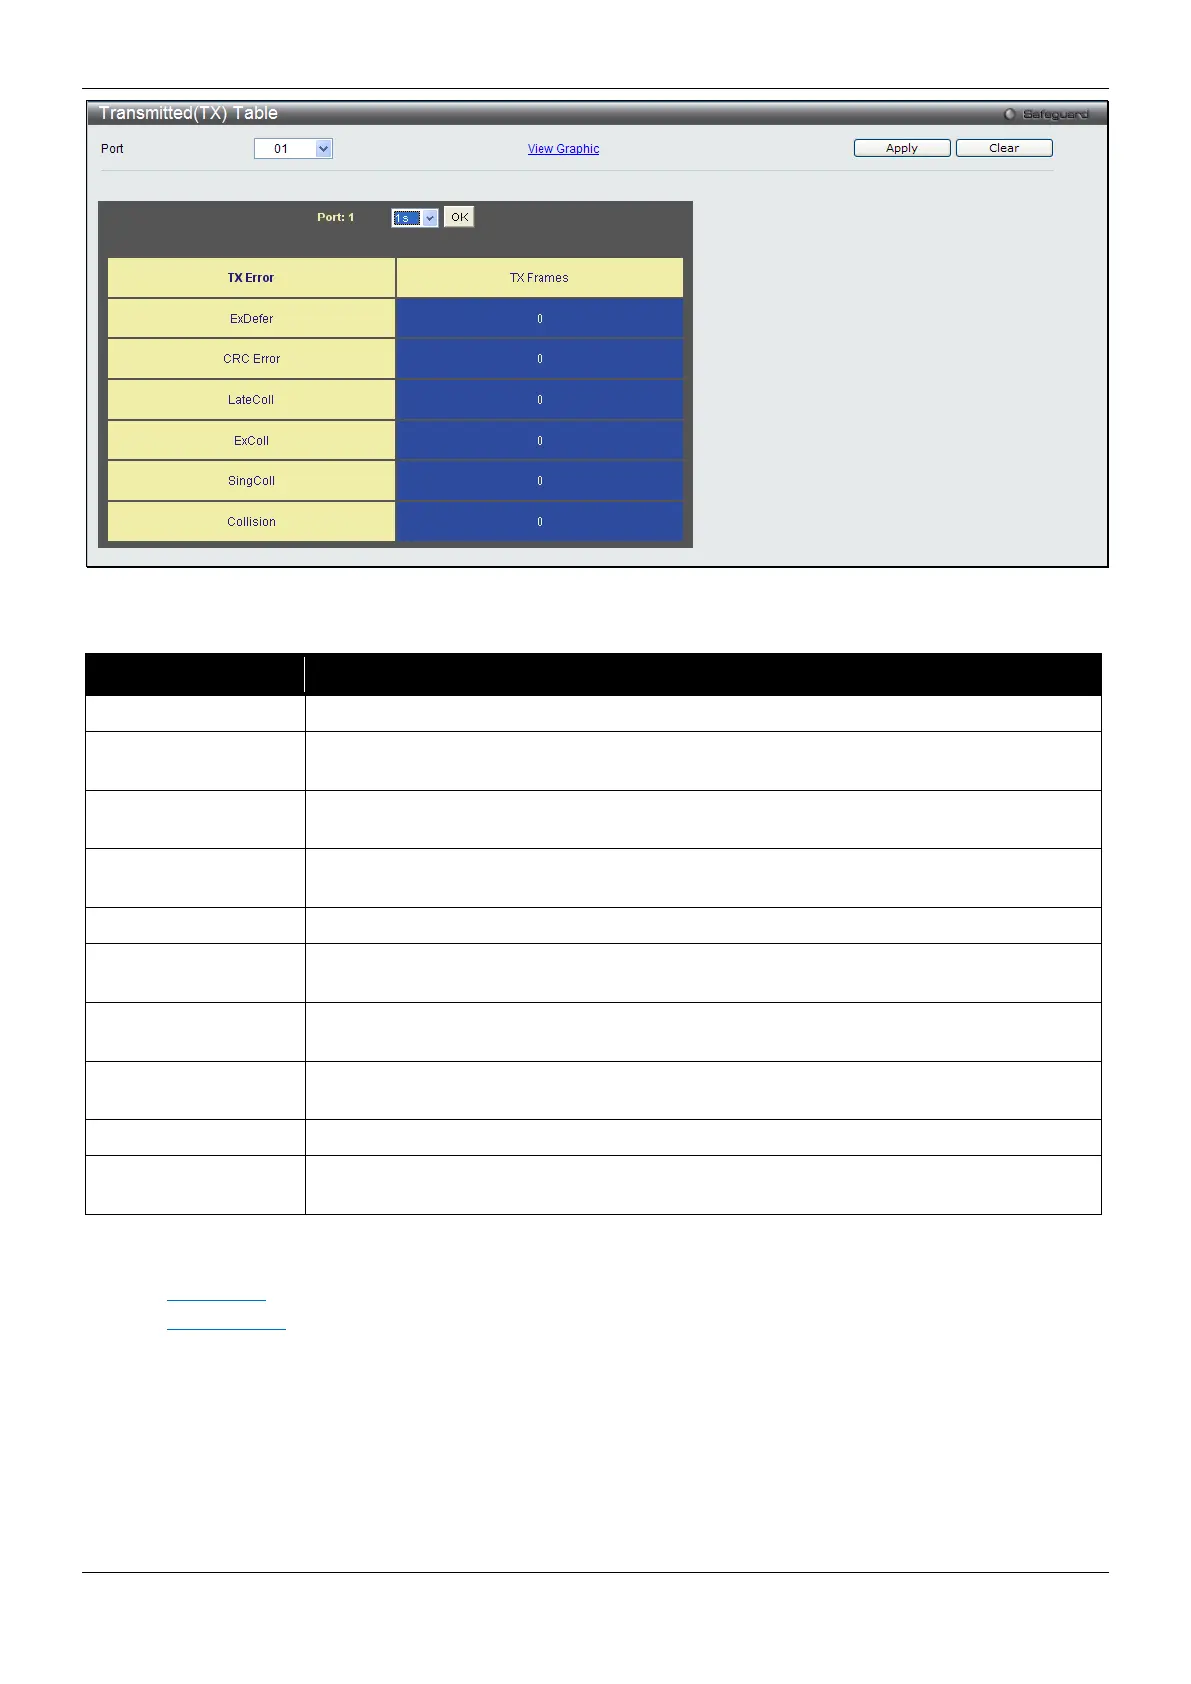
Figure 11-13 TX Error Analysis window (table)
The fields that can be configured or displayed are described below:
Parameter Description
Use the drop-down menu to choose the port that will display statistics.
Time Interval Select the desired setting between 1s and 60s, where "s" stands for seconds. The
default value is one second.
Record Number Select number of times the Switch will be polled between 20 and 200. The default value
ExDefer
Counts the number of packets for which the first transmission attempt on a particular
interface was delayed because the medium was busy.
Counts otherwise valid packets that did not end on a byte (octet) boundary.
LateColl
Counts the number of times that a collision is detected later than 512 bit-times into the
transmission of a packet.
ExColl
Excessive Collisions. The number of packets for which transmission failed due to
SingColl
Single Collision Frames. The number of successfully transmitted packets for which
transmission is inhibited by more than one collision.
An estimate of the total number of collisions on this network segment.
Show/Hide
Check whether or not to display ExDefer, CRCError, LateColl, ExColl, SingColl, and
Click the Apply button to accept the changes made for each individual section.
Click the Clear button to clear all statistics counters on this window.
Click the View Table
link to display the information in a table rather than a line graph.
Click the View Graphic
link to display the information in a line graph rather than a table.
Packet Size
Users can display packets received by the Switch, arranged in six groups and classed by size, as either a line
graph or a table. Two windows are offered. To select a port to view these statistics for, select the port by using the
Port drop-down menu. The user may also use the real-time graphic of the Switch at the top of the web page by
simply clicking on a port.
To view this window, click Monitoring > Statistics > Packet Size as shown below:
 Loading...