RS.8D.M1.22 AK2-SC 255 Reference Manual 191
The STAT f unct io
is covered in t he
sect ion following
GRAPH !
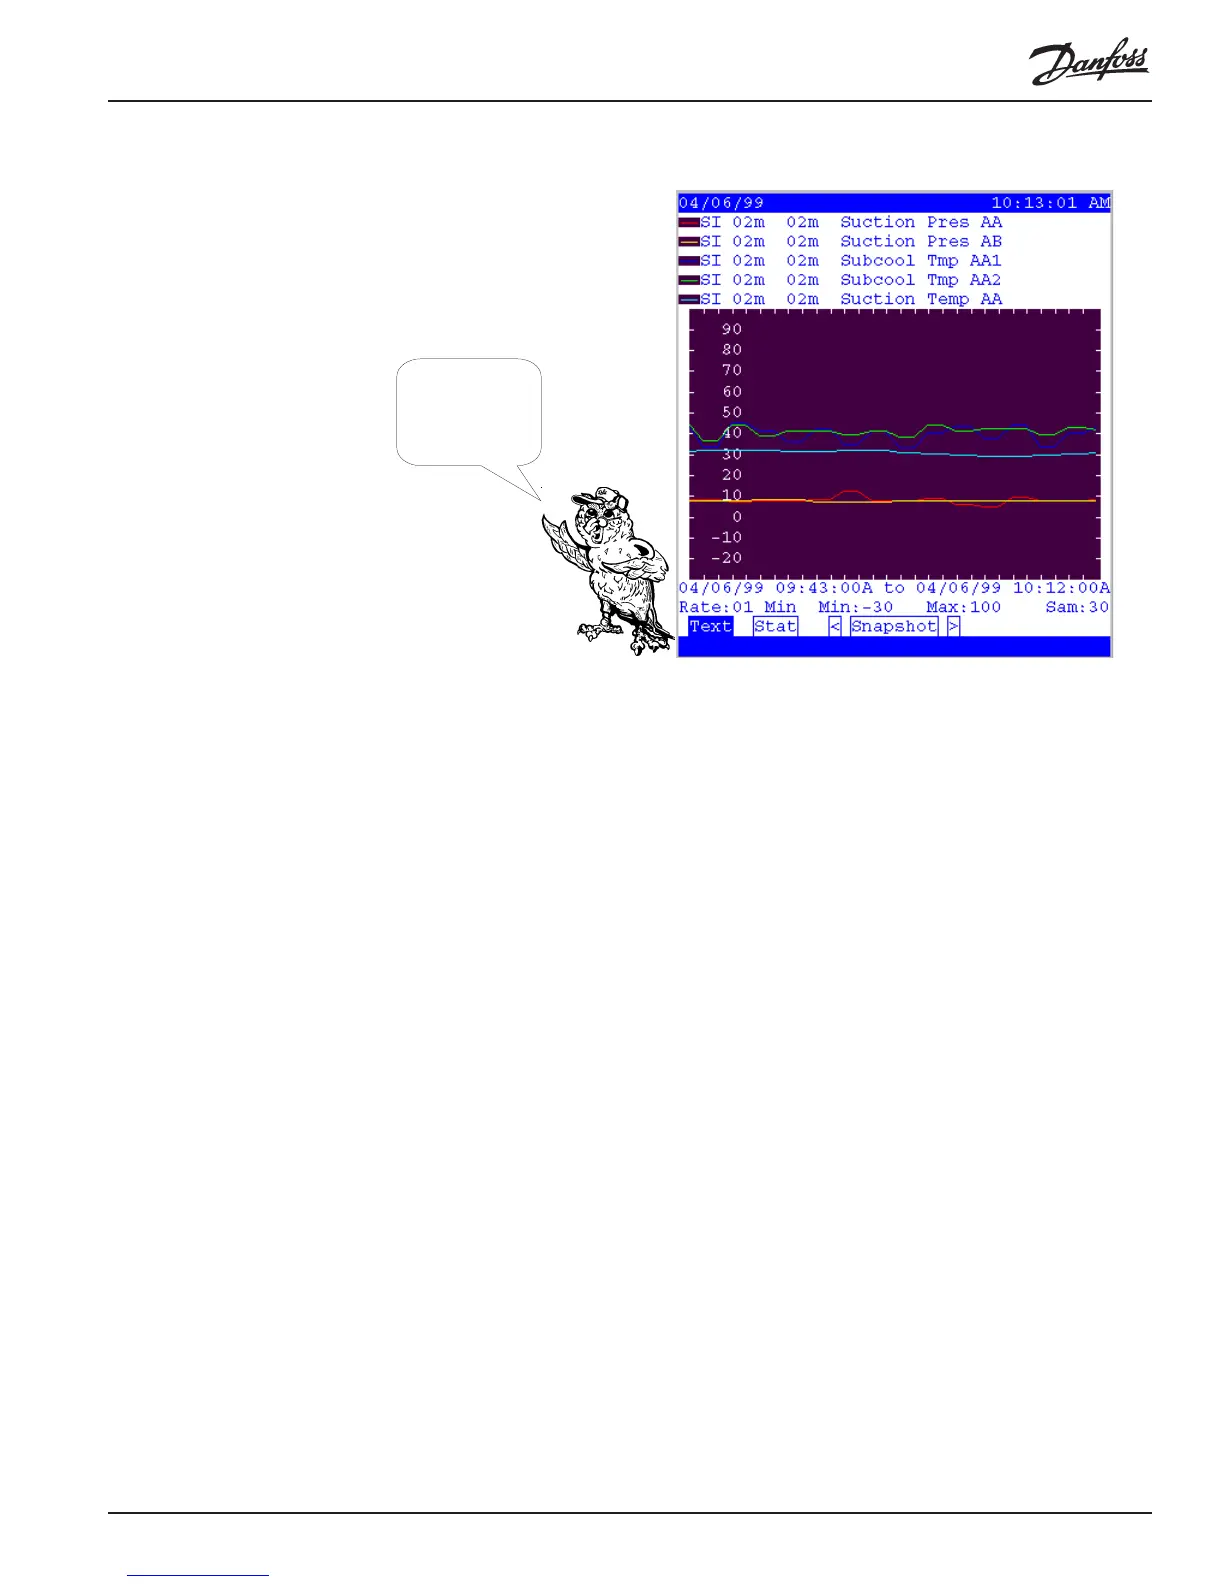
When viewing graphs with AKA 65 software on a PC with a color monitor, the graph
traces will be in color, and their colors will match the key given at the left side of the
upper portion of the screen.
[Due to the mode of reproduction used for this manual, not all the color traces are
visible here.]
Realtime The pictured graph shows four sensor inputs (suction pressures and suction tempera-
tures) and a variable output (the second trace from the top). To exit the graph screen,
press EXIT or click with your mouse in the title bar or gray border above the graph
display. Let’s tour the screen...
Scale The scale of the graph appears on left edge of the display. The scale displayed is
governed by the Min and Max settings on the bottom line of the display. Min can be
any multiple of 10 from -90 to 90. Max can be any multiple of 10 from -80 to 500.
Time The times given at left and right below the graph are the beginning and ending time of
the time period for which data is displayed. These will change as the number of
samples and display rate change.
Sam The number (from 5 to 60) entered in the Sam field specifies the number of samples
to appear in the displayed graph. Changing the number of samples will also change
the time scale under the graph.
Rate The display interval of the graph. Note that the display interval need not be the same
as the sampling interval. When the display interval is larger, not every point will be
plotted; when the display interval is smaller, data will be created to form a smooth
path between real measurements.
Realtime/Snapshot Viewing is in one of two modes. In realtime mode, the history is graphed as it is
collected. In snapshot mode, any of the collected history can be examined. The “<“