VLT
®
AQUA Drive FC 202
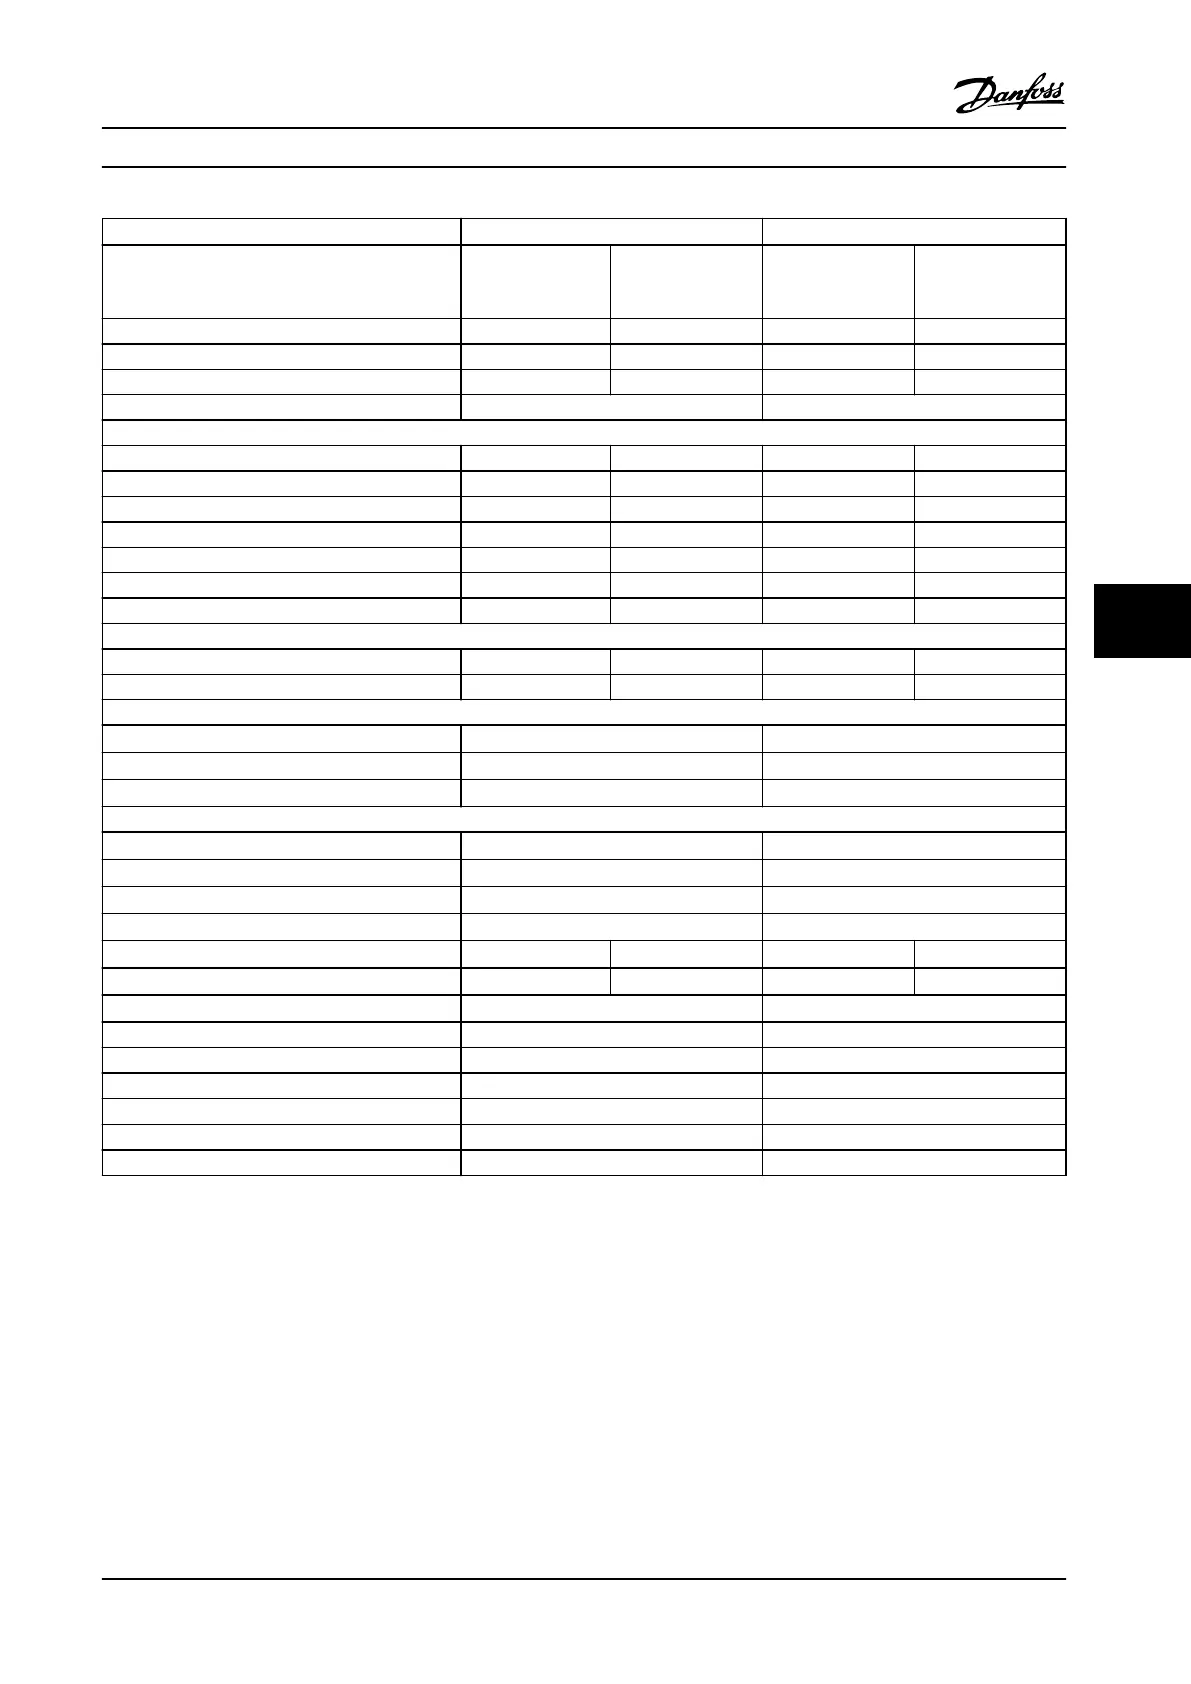
N450 N500
High/normal load HO NO HO NO
(High overload=150% current during 60 s, normal
overload=110% current during 60 s)
Typical shaft output at 525 V [kW] 315 355 315 400
Typical shaft output at 575 V [hp] 400 450 400 500
Typical shaft output at 690 V [kW] 355 450 400 500
Enclosure size E1h/E3h E1h/E3h
Output current (3-phase)
Continuous (at 525 V) [A] 395 470 429 523
Intermittent (60 s overload) (at 525 V) [A] 593 517 644 575
Continuous (at 575/690 V) [A] 380 450 410 500
Intermittent (60 s overload) (at 575/690 V) [A] 570 495 615 550
Continuous kVA (at 525 V) [kVA] 376 448 409 498
Continuous kVA (at 575 V) [kVA] 378 448 408 498
Continuous kVA (at 690 V) [kVA] 454 538 490 598
Maximum input current
Continuous (at 525 V) [A] 381 453 413 504
Continuous (at 575/690 V) [A] 366 434 395 482
Maximum number and size of cables per phase (E1h)
- Mains and motor without brake [mm
2
(AWG)]
5x240 (5x500 mcm) 5x240 (5x500 mcm)
- Mains and motor with brake [mm
2
(AWG)]
4x240 (4x500 mcm) 4x240 (4x500 mcm)
- Brake or regeneration [mm
2
(AWG)]
2x185 (2x350 mcm) 2x185 (2x350 mcm)
Maximum number and size of cables per phase (E3h)
- Mains and motor without brake [mm
2
(AWG)]
6x240 (6x500 mcm) 6x240 (6x500 mcm)
- Mains and motor with brake [mm
2
(AWG)]
2x185 (2x350 mcm) 2x185 (2x350 mcm)
- Load share or regeneration [mm
2
(AWG)]
4x185 (4x350 mcm) 4x185 (4x350 mcm)
Maximum external mains fuses [A]
1)
800 800
Estimated power loss at 600 V [W]
2), 3)
4989 6062 5419 6879
Estimated power loss at 690 V [W]
2), 3)
4920 5939 5332 6715
Eciency
3)
0.98 0.98
Output frequency [Hz] 0–500 0–500
Heat sink overtemperature trip [°C (°F)]
110 (230) 110 (230)
Control card overtemperature trip [°C (°F)]
80 (176) 80 (176)
Power card overtemperature trip [°C (°F)]
85 (185) 85 (185)
Fan power card overtemperature trip [°C (°F)]
85 (185) 85 (185)
Active in-rush card overtemperature trip [°C (°F)]
85 (185) 85 (185)
Table 7.9 Electrical Data for Enclosures E1h/E3h, Mains Supply 3x525–690 V AC
1) For fuse ratings, see chapter 10.5 Fuses and Circuit Breakers.
2) Typical power loss is at normal conditions and expected to be within
±
15% (tolerance relates to variety in voltage and cable conditions). These
values are based on a typical motor eciency (IE/IE3 border line). Lower eciency motors add to the power loss in the drive. Applies for
dimensioning of drive cooling. If the switching frequency is higher than the default setting, the power losses can increase. LCP and typical control
card power consumptions are included. For power loss data according to EN 50598-2, refer to drives.danfoss.com/knowledge-center/energy-
eciency-directive/#/. Options and customer load can add up to 30 W to the losses, though usually a fully loaded control card and options for
slots A and B each add only 4 W.
3) Measured using 5 m (16.4 ft) shielded motor cables at rated load and rated frequency. Eciency measured at nominal current. For energy
eciency class, see chapter 7.5 Ambient Conditions. For part load losses, see drives.danfoss.com/knowledge-center/energy-eciency-directive/#/.
Specications Design Guide
MG22B222 Danfoss A/S © 01/2018 All rights reserved. 49
7 7

 Loading...