VLT
®
AQUA Drive FC 202
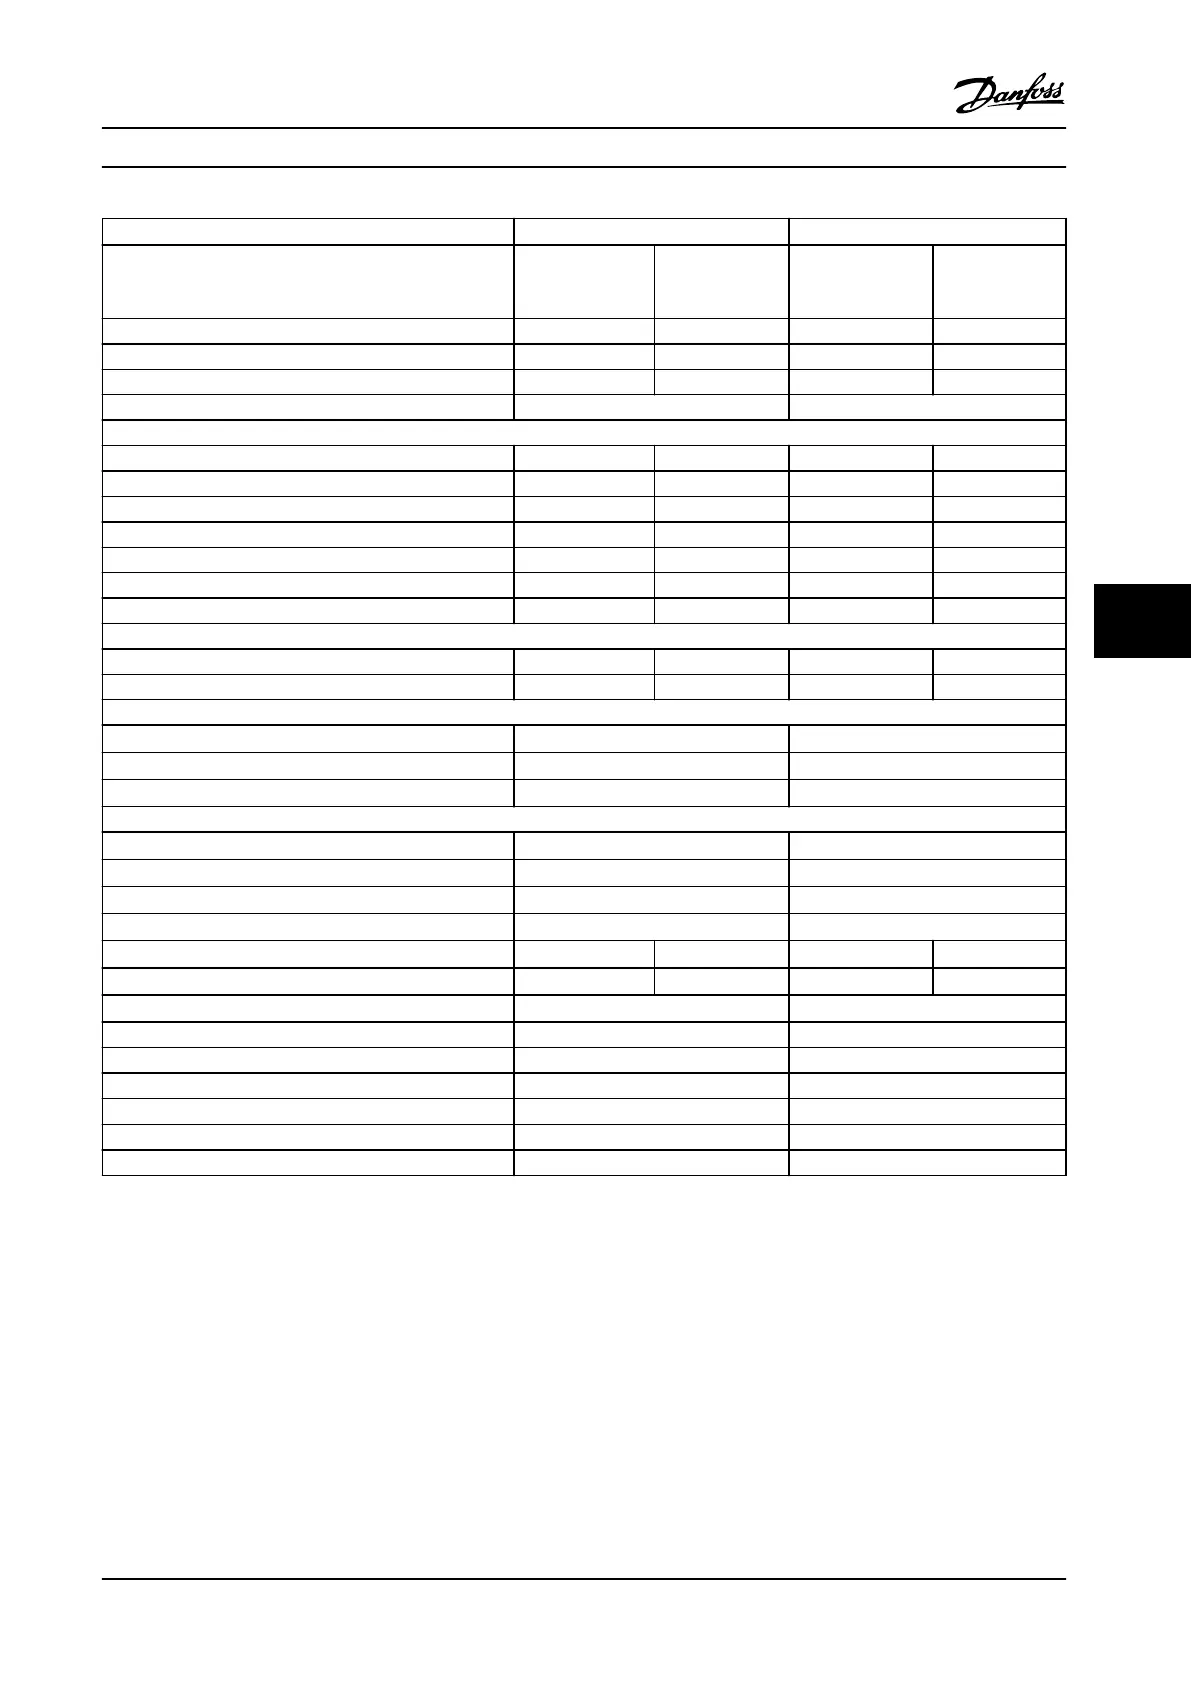
N710 N800
High/normal load HO NO HO NO
(High overload=150% current during 60 s, normal
overload=110% current during 60 s)
Typical shaft output at 525 V [kW] 500 560 560 670
Typical shaft output at 575 V [hp] 650 750 750 950
Typical shaft output at 690 V [kW] 630 710 710 800
Enclosure size E2h/E4h E2h/E4h
Output current (3-phase)
Continuous (at 525 V) [A] 659 763 763 889
Intermittent (60 s overload) (at 525 V) [A] 989 839 1145 978
Continuous (at 575/690 V) [A] 630 730 730 850
Intermittent (60 s overload) (at 575/690 V) [A] 945 803 1095 935
Continuous kVA (at 525 V) [kVA] 628 727 727 847
Continuous kVA (at 575 V) [kVA] 627 727 727 847
Continuous kVA (at 690 V) [kVA] 753 872 872 1016
Maximum input current
Continuous (at 525 V) [A] 635 735 735 857
Continuous (at 575/690 V) [A] 607 704 704 819
Maximum number and size of cables per phase (E2h)
- Mains and motor without brake [mm
2
(AWG)]
6x240 (6x500 mcm) 6x240 (6x500 mcm)
- Mains and motor with brake [mm
2
(AWG)]
5x240 (5x500 mcm) 5x240 (5x500 mcm)
- Brake or regeneration [mm
2
(AWG)]
2x185 (2x350 mcm) 2x185 (2x350 mcm)
Maximum number and size of cables per phase (E4h)
- Mains and motor without brake [mm
2
(AWG)]
6x240 (6x500 mcm) 6x240 (6x500 mcm)
- Mains and motor with brake [mm
2
(AWG)]
2x185 (2x350 mcm) 2x185 (2x350 mcm)
- Load share or regeneration [mm
2
(AWG)]
4x185 (4x350 mcm) 4x185 (4x350 mcm)
Maximum external mains fuses [A]
1)
1200 1200
Estimated power loss at 600 V [W]
2), 3)
8543 10346 10319 12723
Estimated power loss at 690 V [W]
2), 3)
8363 10066 10060 12321
Eciency
3)
0.98 0.98
Output frequency [Hz] 0–500 0–500
Heat sink overtemperature trip [°C (°F)]
110 (230) 110 (230)
Control card overtemperature trip [°C (°F)]
80 (176) 80 (176)
Power card overtemperature trip [°C (°F)]
85 (185) 85 (185)
Fan power card overtemperature trip [°C (°F)]
85 (185) 85 (185)
Active in-rush card overtemperature trip [°C (°F)]
85 (185) 85 (185)
Table 7.11 Electrical Data for Enclosures E2h/E4h, Mains Supply 3x525–690 V AC
1) For fuse ratings, see chapter 10.5 Fuses and Circuit Breakers.
2) Typical power loss is at normal conditions and expected to be within
±
15% (tolerance relates to variety in voltage and cable conditions). These
values are based on a typical motor eciency (IE/IE3 border line). Lower eciency motors add to the power loss in the drive. Applies for
dimensioning of drive cooling. If the switching frequency is higher than the default setting, the power losses can increase. LCP and typical control
card power consumptions are included. For power loss data according to EN 50598-2, refer to drives.danfoss.com/knowledge-center/energy-
eciency-directive/#/. Options and customer load can add up to 30 W to the losses, though usually a fully loaded control card and options for
slots A and B each add only 4 W.
3) Measured using 5 m (16.4 ft) shielded motor cables at rated load and rated frequency. Eciency measured at nominal current. For energy
eciency class, see chapter 7.5 Ambient Conditions. For part load losses, see drives.danfoss.com/knowledge-center/energy-eciency-directive/#/.
Specications Design Guide
MG22B222 Danfoss A/S © 01/2018 All rights reserved. 51
7 7

 Loading...