Operation and parameterization 38
Manual econ sens3 Version 3.0
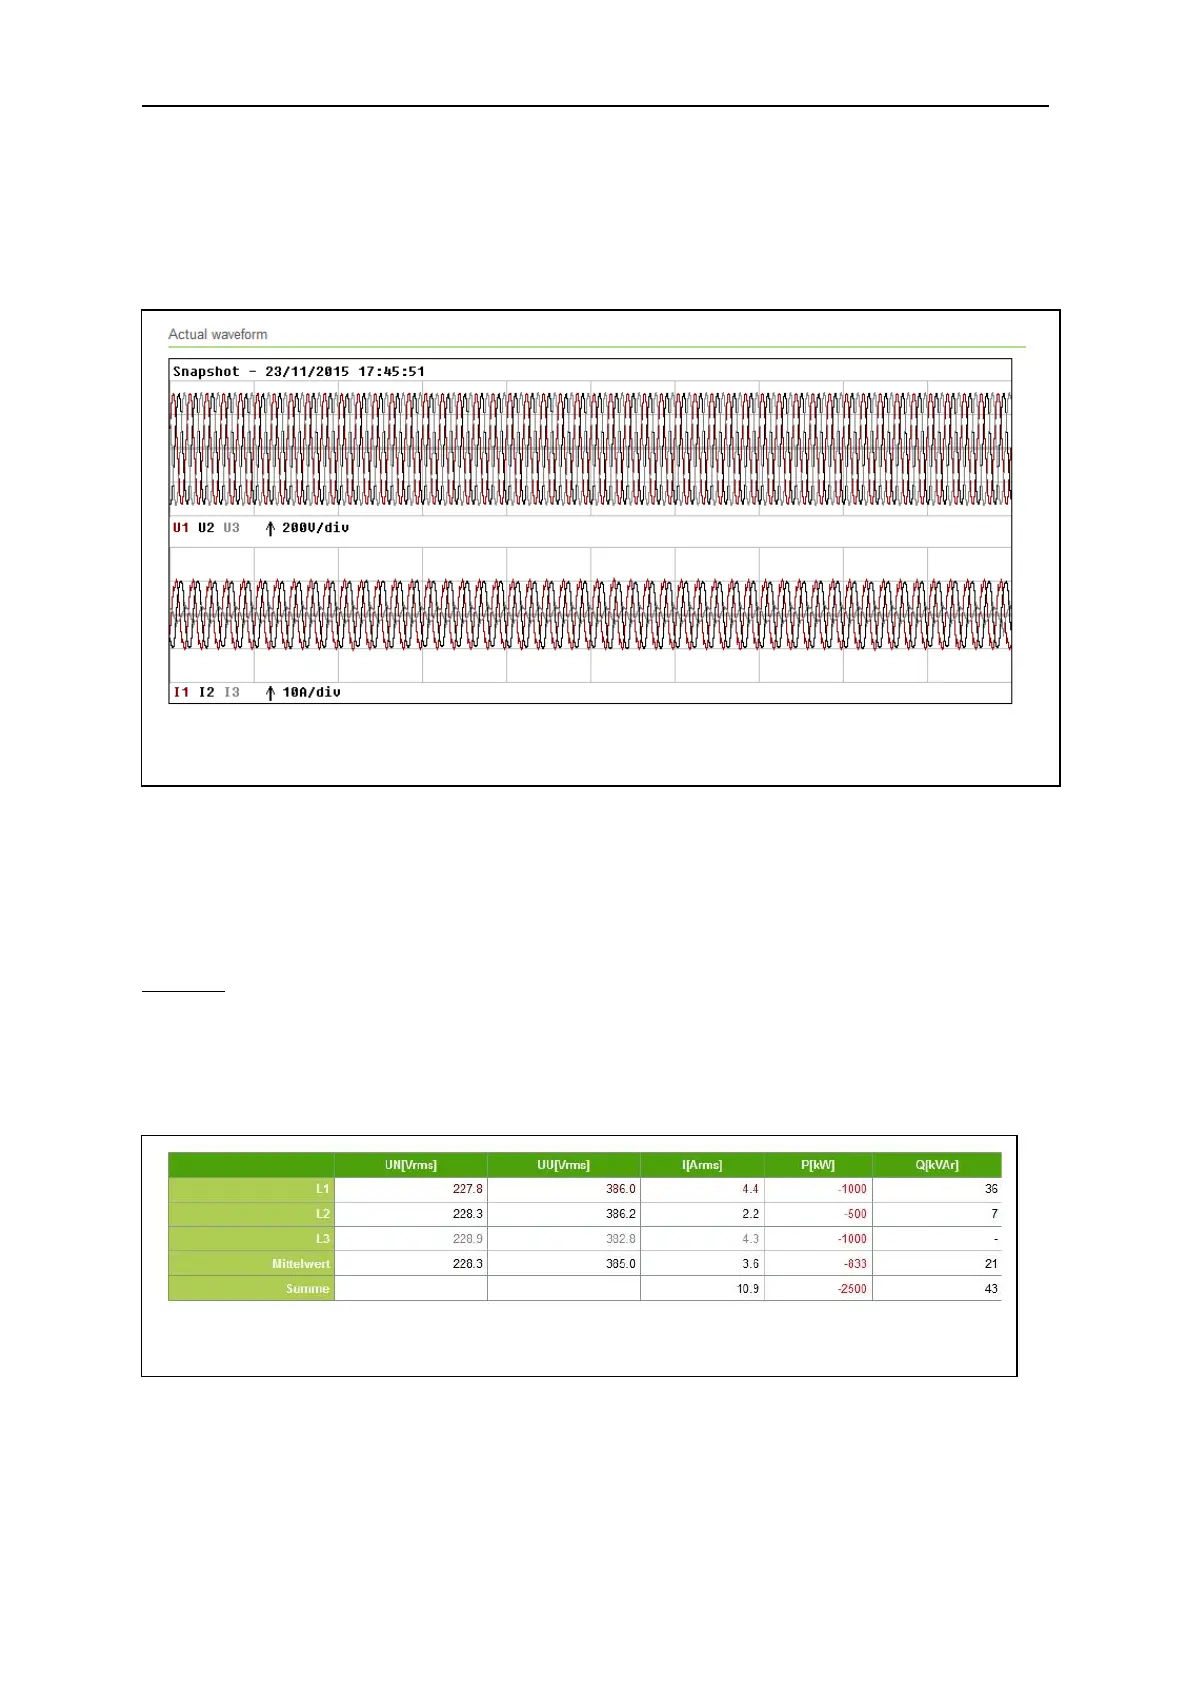
You can display the voltage and current curves on the three phases as a waveform by going to
Waveform Snapshot at the lower left edge of the screen.
This will generate and display a one-second snapshot of the waveform (see Fig. 32). This image will
be included in the list of events in the PRO version if the Snapshot Option (Events submenu in
Chapter 8.10) is activated.
The econ sens3 is able to measure and display both the generated and the consumed active power.
Consumed active power is shown in blue in the table, and the generated active power is shown in red
with a negative sign. If power is consumed and generated concurrently one a phase, the econ sens3
shows the sum of these two powers.
Example:
You generate with your photovoltaic system with downstream inverter on the three L1, L2, and L3
phases 1kW each and in doing so, consume 500 watts for various household appliances on phase L2.
In that case, your measurement value table would look like the table in Fig. 33.