Operation and parameterization 41
Manual econ sens3 Version 3.0
Therefore, always ensure correct installation of the measuring coils and their assignment to the
voltage path to prevent misunderstandings.
8.4 Analysis menu
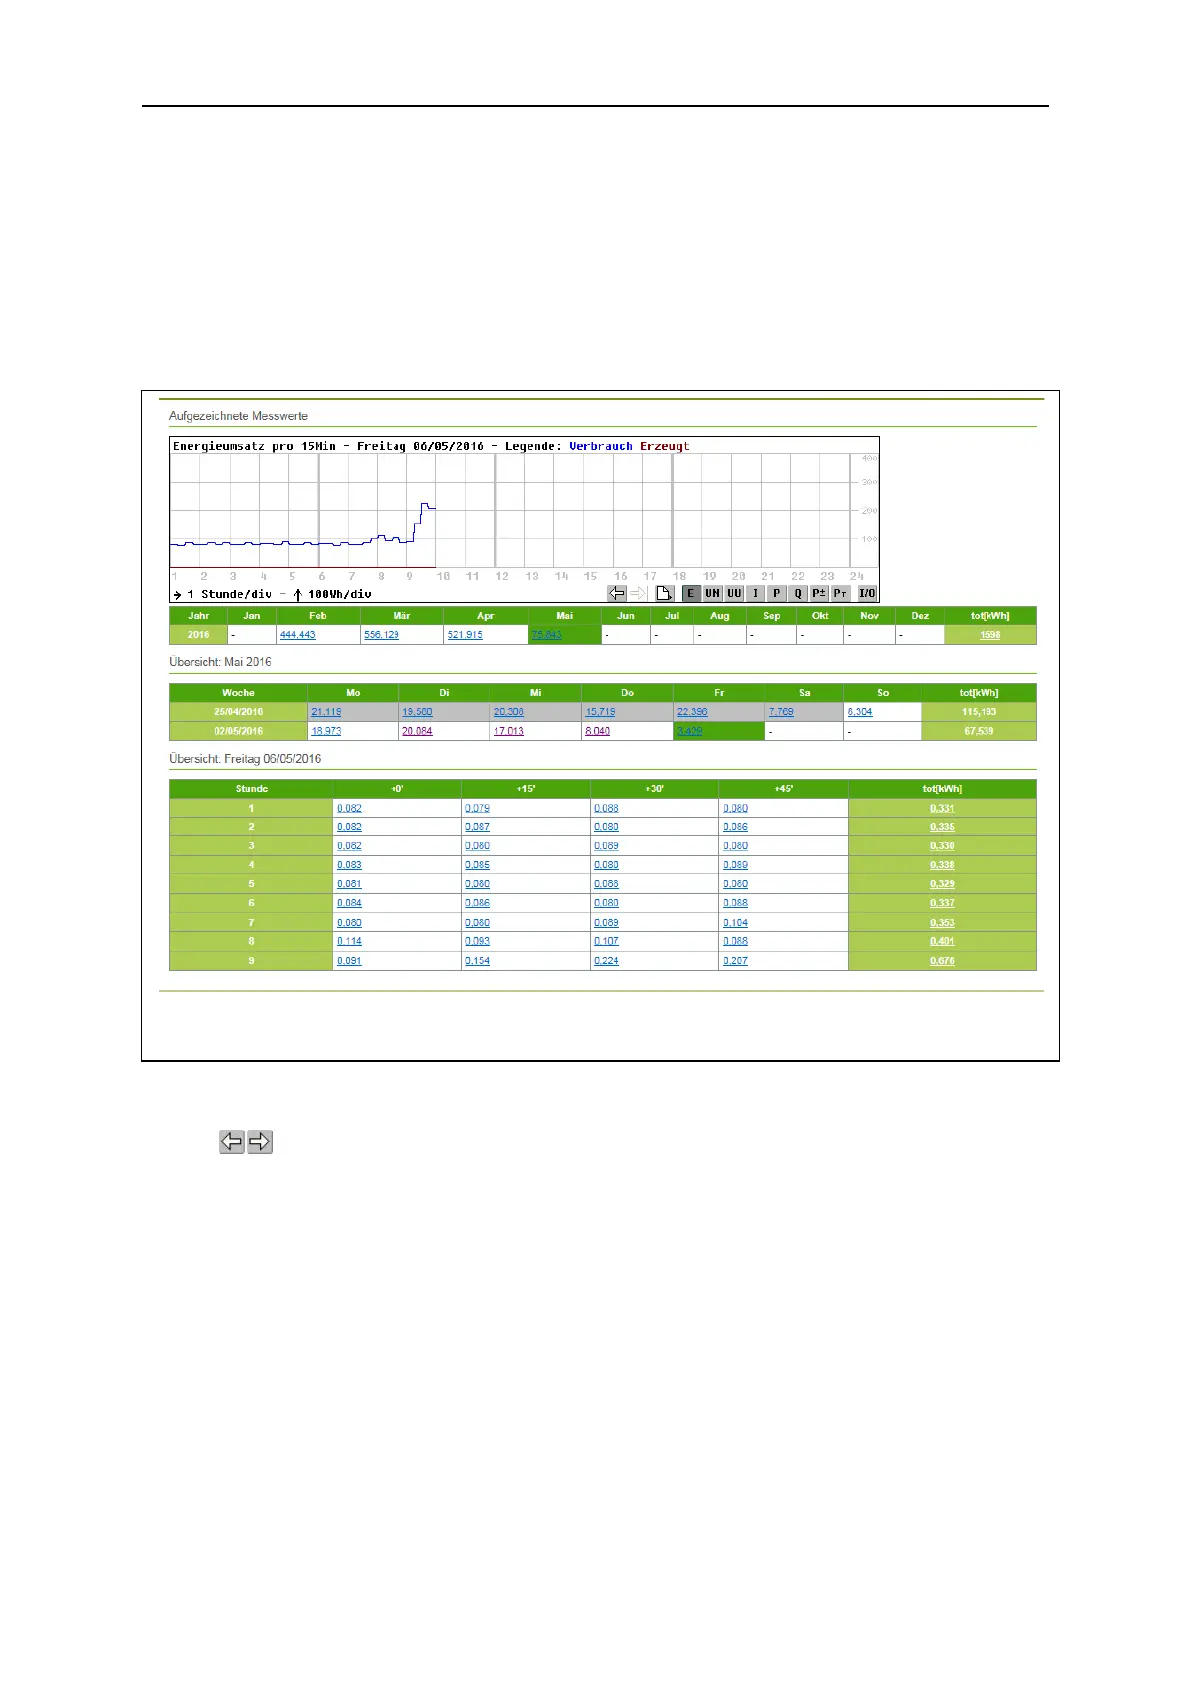
In the Graphs menu, the measurement results are processed graphically for the user and displayed as
a measurement curve. Fig. 37 shows an example of such a measurement curve.
Displayed is respectively the sum of the power/energy from the three phases over a specified period.
Use the buttons next to the X-axis title to browse through the measurement curves step by step
(e.g. every day of the month).