Operation and parameterization 40
Manual econ sens3 Version 3.0
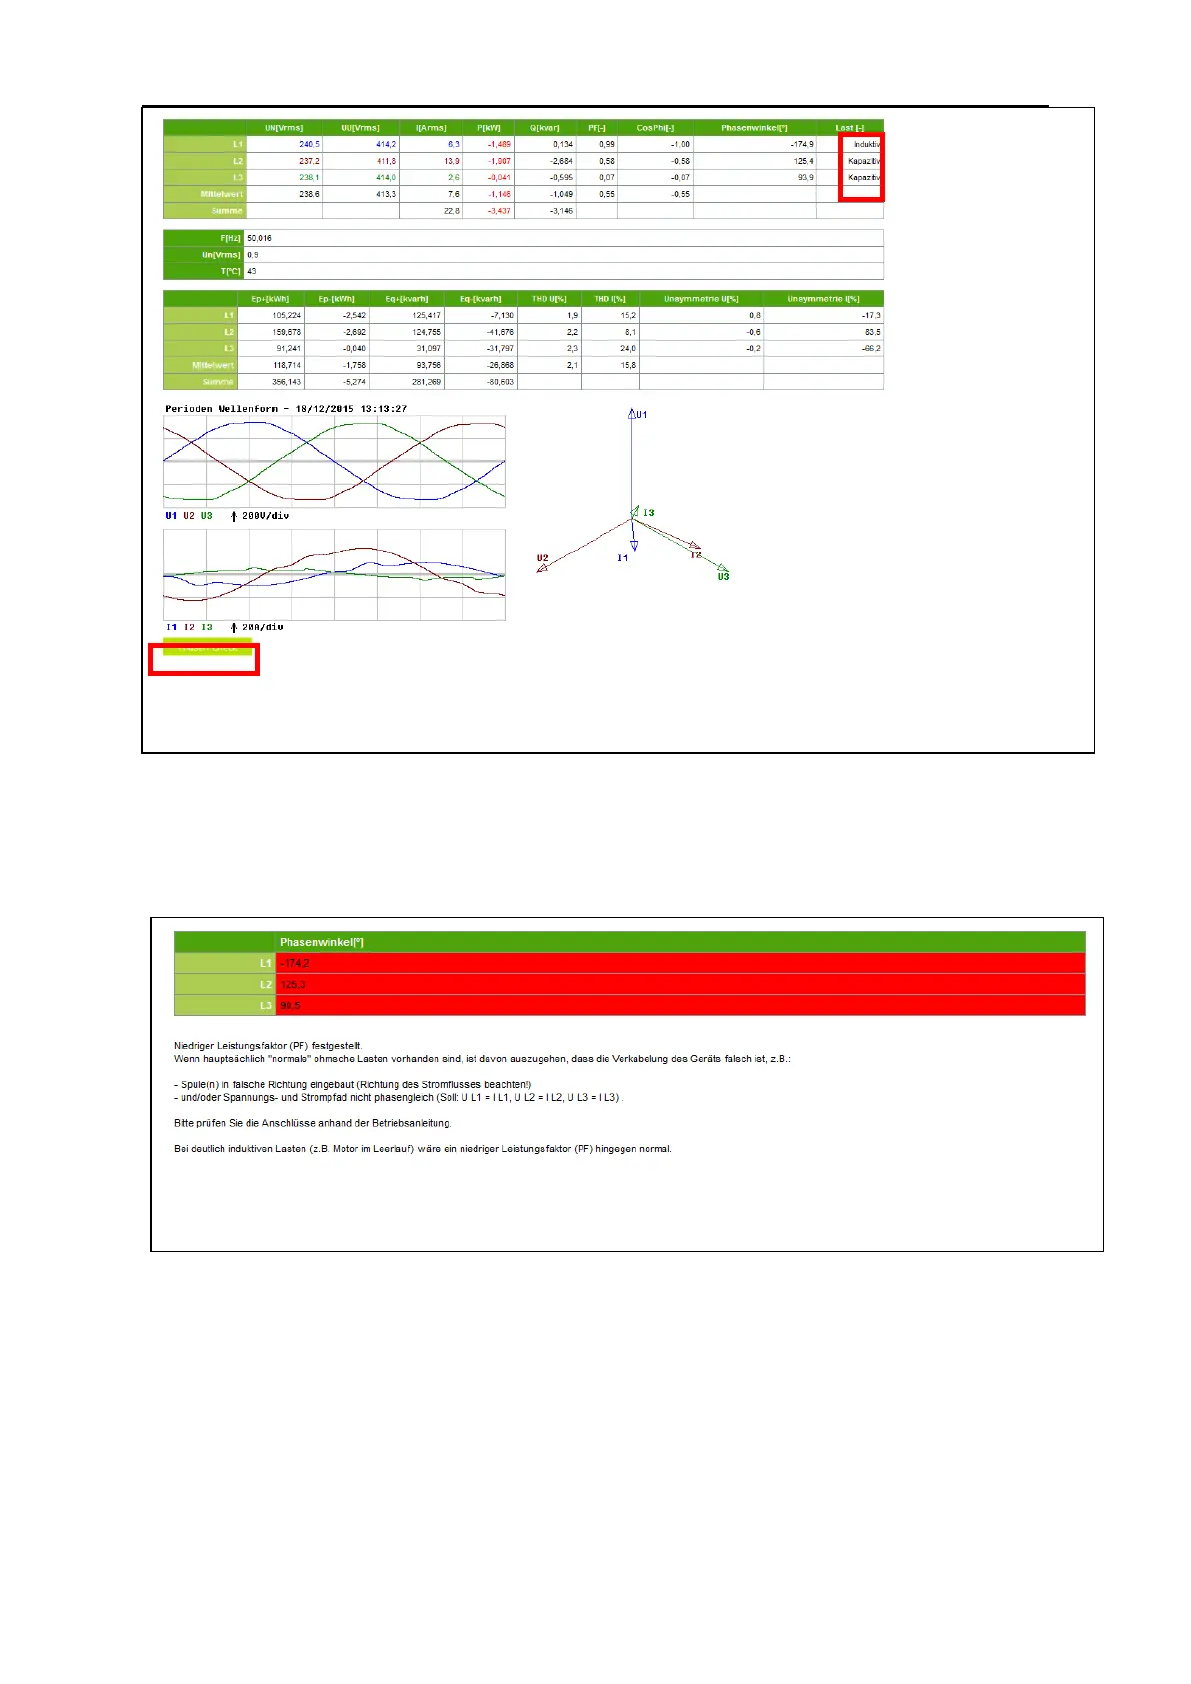
It can be seen in the measurement value table that the power factor of phase 2 has fallen below 0.71
and the phase displacement between U2 and I2 in the “phase angle” graphic shows 125.3°. This is a
typical error pattern for the installation error mentioned above. The “Phase check” function provides an
indication of this (see Figure 36).
Note:
Because of the simplicity of the installation test routine, there are cases in which no installation error
occurred but the routine nevertheless outputs an error message, e.g.:
a. ) In the measured network, only generated and little to no consumed power occurs
b. ) The power factor of the connected load is in fact < 0.71