Operation and parameterization 37
Manual econ sens3 Version 3.0
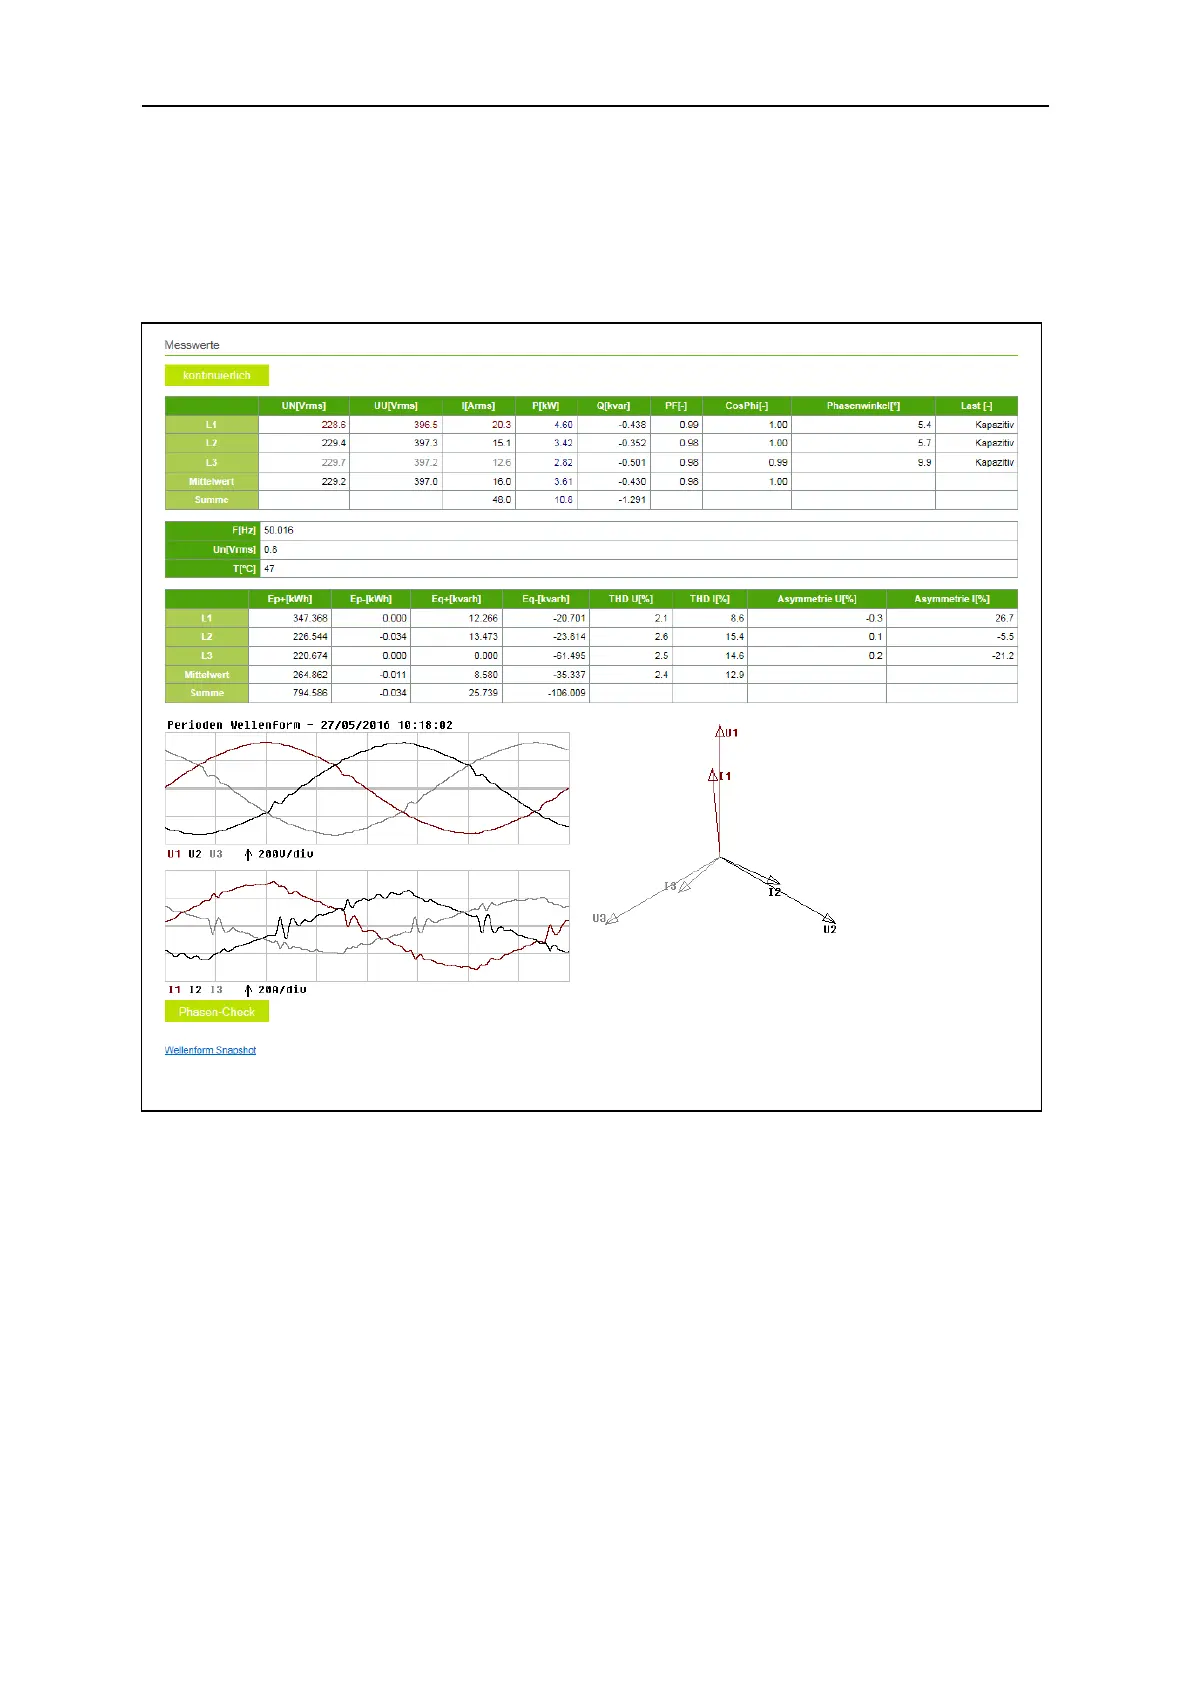
8.3 Measurement menu
The econ sens3 displays the values it measured in the Measurement menu in table format. Fig. 31
shows this table.
Displayed are phase L1, L2, L3 voltages and the associated currents, as well as the active and
reactive power for each phase and the “power factor” (for purely sinusoidal alternating currents, this
corresponds to the generally known cos phi). The generated and returned active and reactive energy,
as well as the measured values for the total harmonic distortion (voltage/current) and the asymmetry
(voltage/current) are found in the second table.
You can refresh the display repeatedly by pressing the F5 key on your keyboard or pressing the arrow
button next to “continuous.” Then the display will be updated in one second intervals.
The arrow graphics below the table are used to illustrate the phase shifts between the L1, L2, and L3
voltages and the associated currents.
*The statement “Un” below the table shows the so-called neutral conductor voltage (voltage difference between the neutral
conductor and the protective earth). This is needed for the Events menu, which deals with network analysis. Activation of this
menu is optional.