Chapter 4. API Guides
save changes, go back to Configuring ESP32-S2 Target and return here to start debugging.
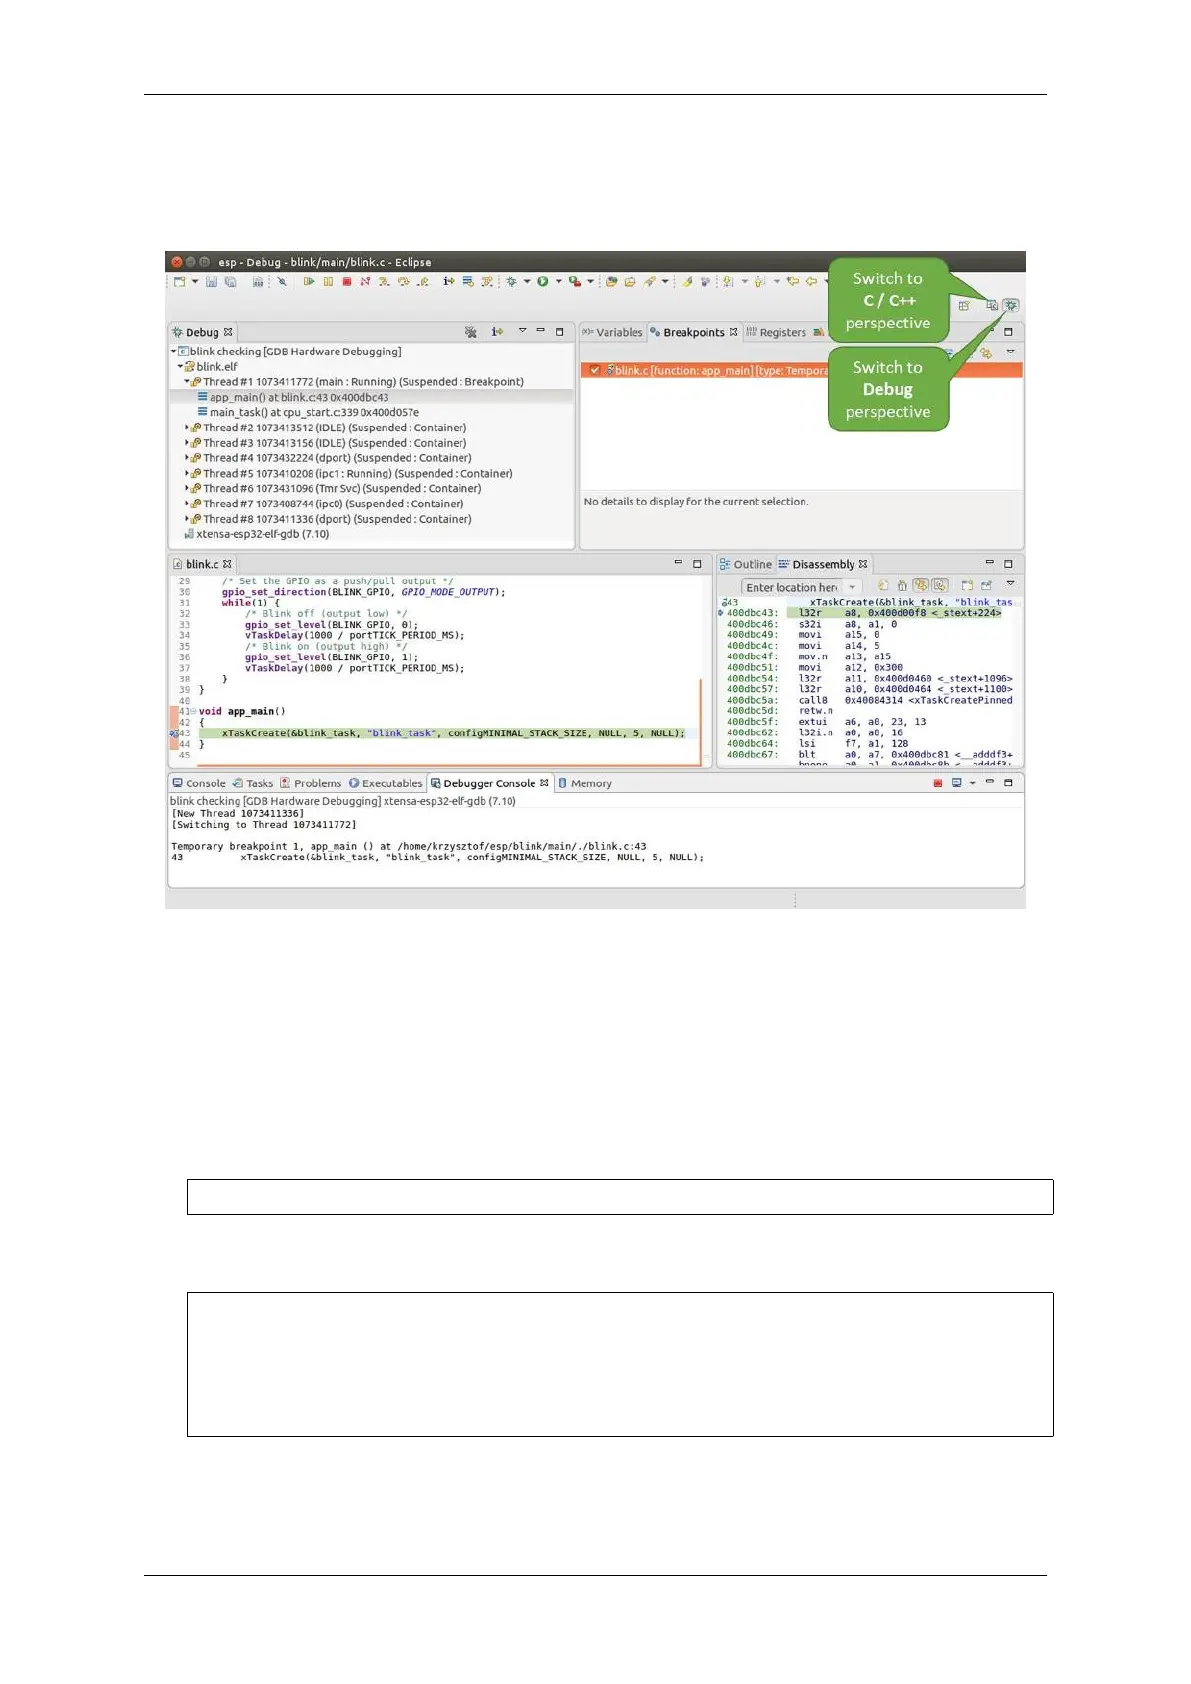
Once all 1 - 12 configuration steps are satisfied, the new Eclipse perspective called “Debug”will open as shown on
example picture below.
Fig. 25: Debug Perspective in Eclipse
If you are not quite sure how to use GDB, check Eclipse example debugging session in section Debugging Examples.
Command Line
1. Begin with completing steps described under Configuring ESP32-S2 Target. This is prerequisite to start a
debugging session.
2. Open a new terminal session and go to directory that contains project for debugging, e.g.
cd ~/esp/blink
3. When launching a debugger, you will need to provide couple of configuration parameters and commands.
Instead of entering them one by one in command line, create a configuration file and name it gdbinit:
target remote :3333
set remote hardware-watchpoint-limit 2
mon reset halt
flushregs
thb app_main
c
Save this file in current directory.
For more details what’s inside gdbinit file, see What is the meaning of debugger’s startup commands?
4. Now you are ready to launch GDB. Type the following in terminal:
Espressif Systems 1390
Submit Document Feedback
Release v4.4