FISCHER Mess- und Regeltechnik GmbH Operation | 5
BA_EN_DE90 75
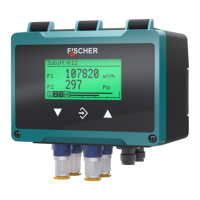
Linear approximation of the characteristic curve
Field tests have shown that the curvature of the filter characteristic curve is of-
ten very small. In these cases, a linear approximation is completely sufficient.
50
Δp
Q
1
100
150
200
250
300
2 3 4 5 6 7 8 9 10
[1000 m
3
/h]
[Pa]
filter characteristic curve
soiled filter
filter characteristic curve
clean filter
Q
min
Q
max
Δp
max (soiled)
Δp
max (clean)
Fig.106: Approximated linear filter characteristic curve
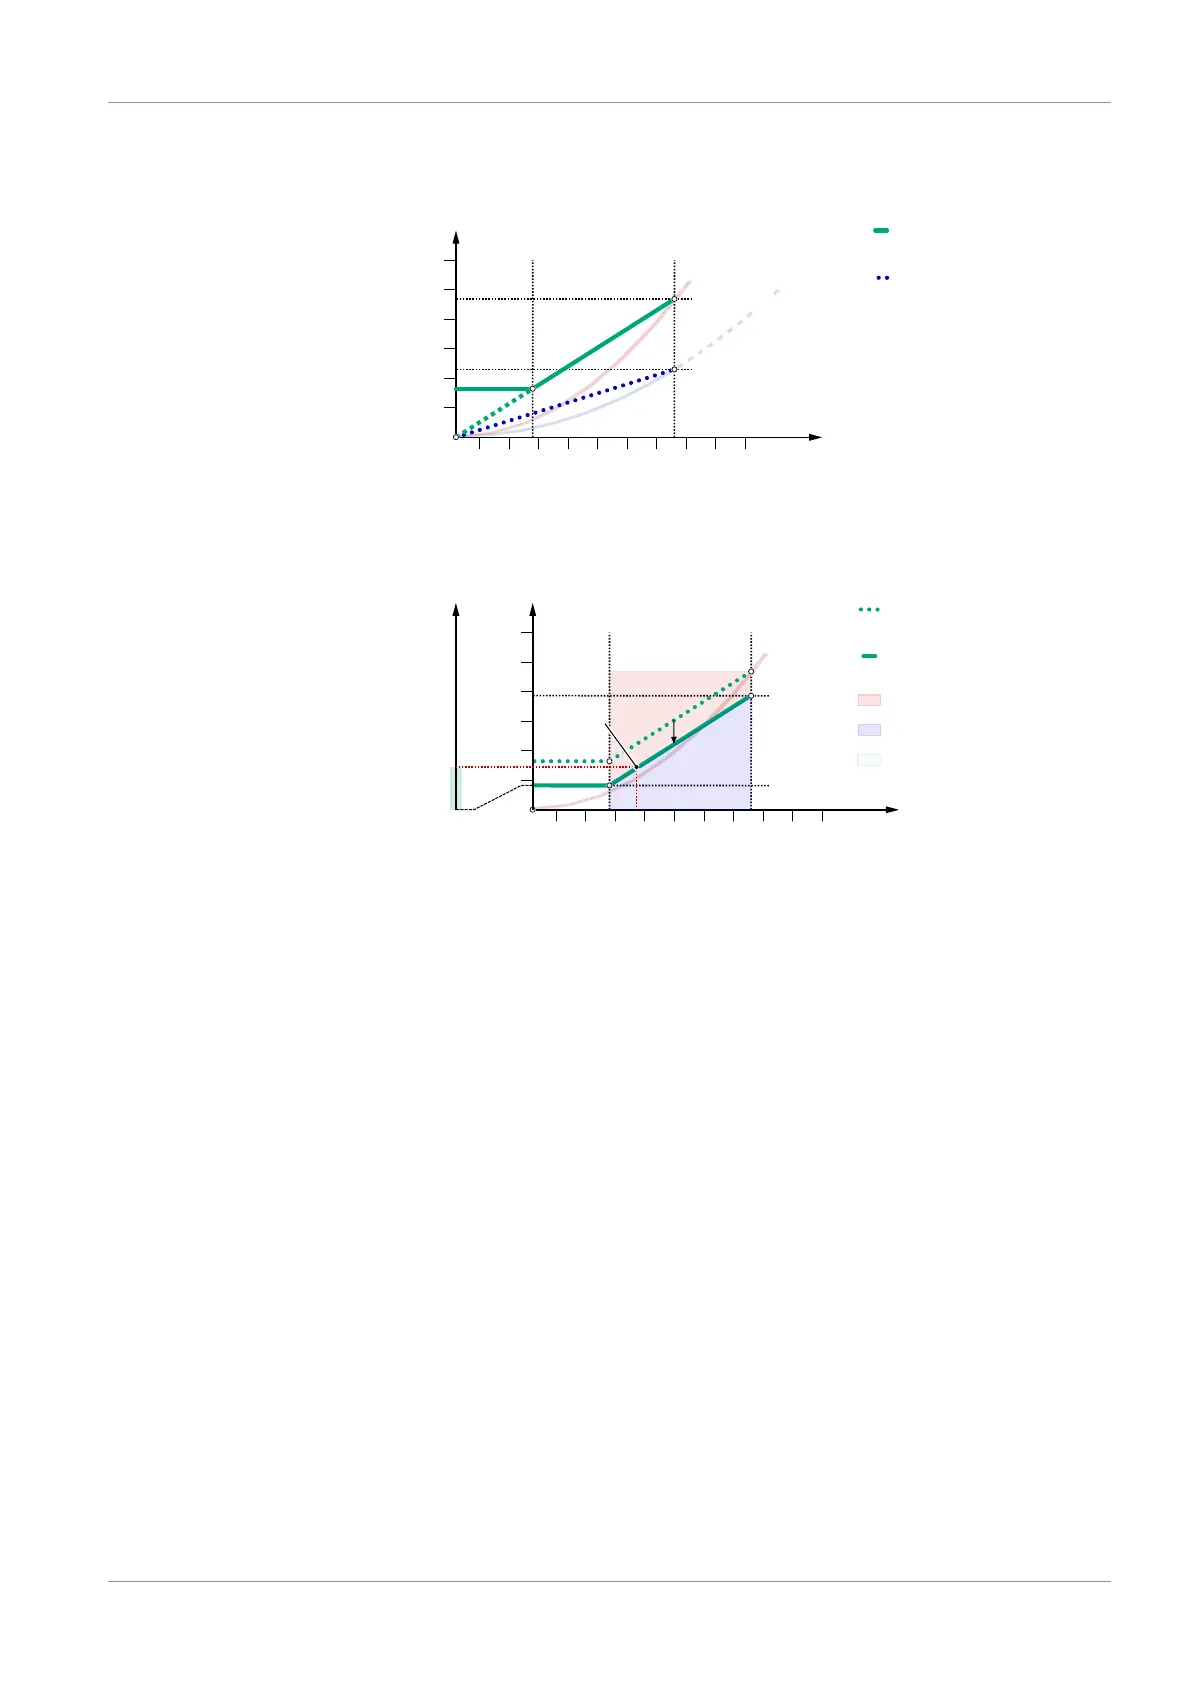
The ∆p correction value parameter can be used to set an offset for the
linear characteristic curve so that the deviation from the real filter characteristic
curve is minimized over the entire operating range.
Δp
Q
1
100
150
250
300
2 3 4 5 6 7 8 9 10
[1000 m
3
/h]
[Pa]
Corrected filter characteristic
curve soiled filter
soiled filter
cleanfilter
Q
min
Q
max
Δp
max (soiled)
Offset
filter characteristic curve
soiled filter
0%
100%
[%]
Display range
50
200
Soiling
Volume flow
Operating point
Fig.107: Correction value Linear filter characteristic curve
The measurement errors resulting from the characteristic curve shift are much
smaller than shown in the graph, since the curvature of the real characteristic
curve is significantly smaller. This superelevation was chosen for reasons of
presentation.
With the parameters Displ.range C3 start and Displ.range C3
end the display characteristic curve can be spread appropriately. Since the
limit curve for the contaminated filter is now fixed, the degree of contamination
of the filter can be determined dynamically for any operating point.