Troubleshooting 230
Determining Values
On the color registration chart, there are two types of charts: Chart 1 (fast scan) and Chart 2 (slow
scan).
The Chart 1 is used to adjust the color registration for the fast scan direction, which is vertical to paper
feed direction. The Chart 2 is used to adjust the color registration for the slow scan direction, which is
horizontal to paper feed direction.
The following sections explain how to determine the adjustment values for the fast scan and the slow
scan using Chart 1 and Chart 2.
Fast Scan
On the Chart 1 of the color registration chart, find the straightest lines where the two black lines and
the colored line are most closely aligned for each color (Y, M, and C). If you find the straightest line,
make a note of the value (-9
to +9) indicated by the straightest line for each color.
When the value is 0 for each color, you do not need to adjust the color registration for the fast scan.
When the value is not 0, enter the value using the procedure in "Entering Values" on page 231.
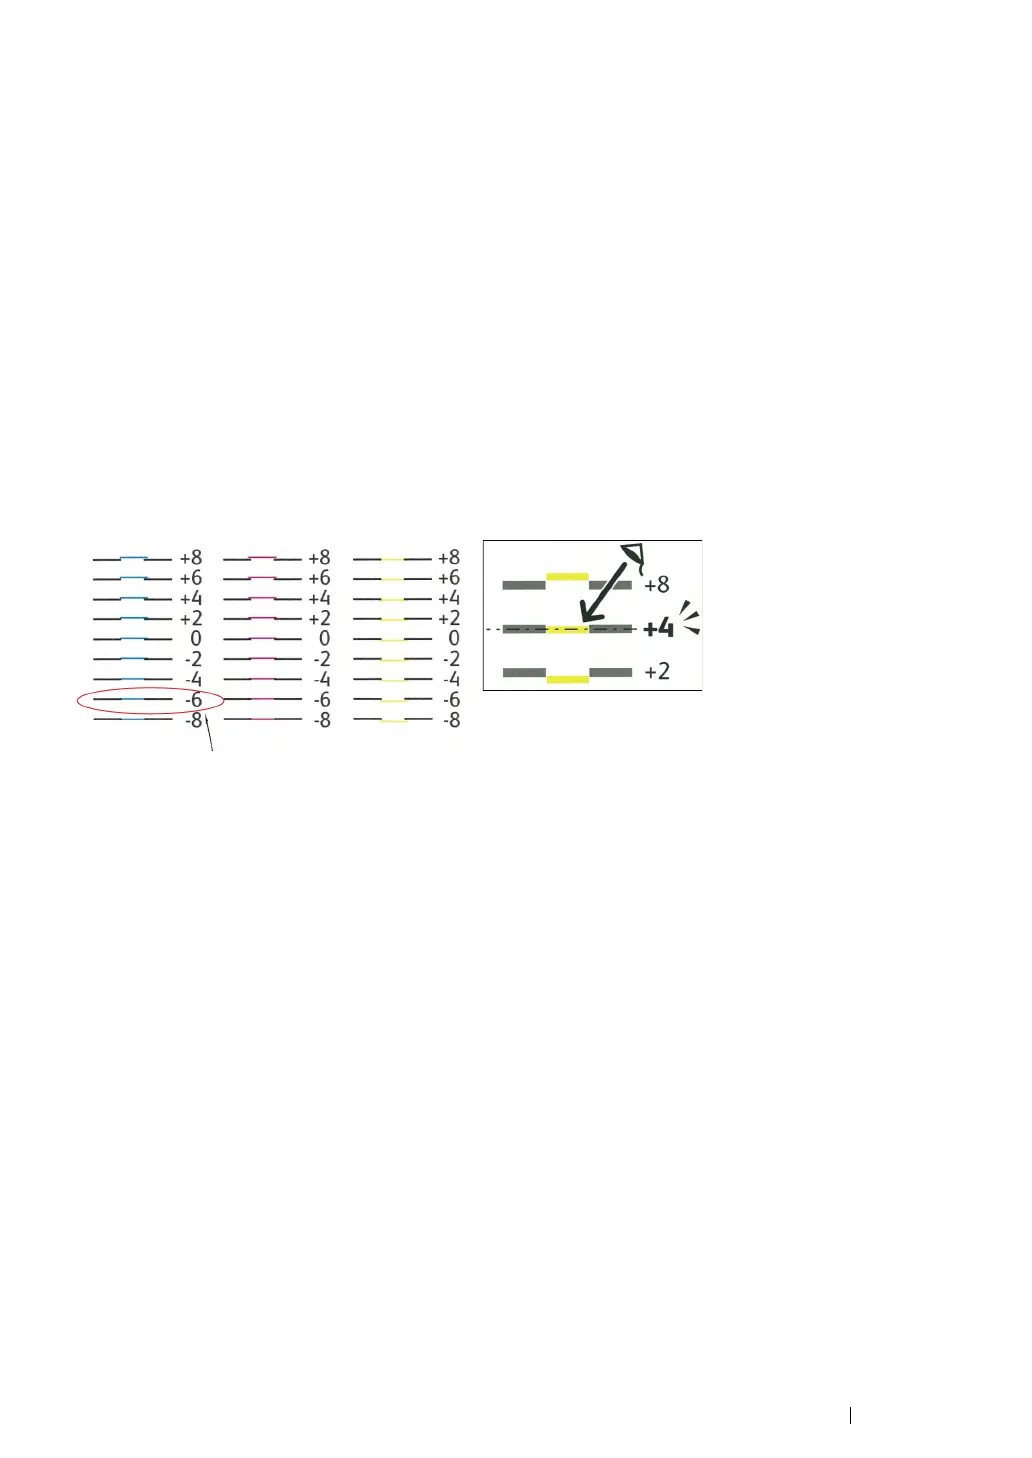
Slow Scan
On the Chart 2 of the color registration chart, find the medium line within the range of white area for
each color pattern (Y, M, and C). If you find the medium line, make a note of the value (-9
to +9)
indicated by the medium line for each color.
When the value is 0 for each color, you do not need to adjust the color registration for the slow scan.
When the value is not 0, enter the value using the procedure in "Entering Values" on page 231.
 Loading...