om 5184516-100 Rev. 5 6-34
The Length line (actual line or control points) will be included on the film output of
the Stenosis data. If any part of the Length line extends beyond the black circle
mask surrounding the image, it will not be displayed on the film.
18-8Show Data
Select this feature button to display the results for any stenosis measurements
functions recently performed. This window can be moved on the image screen by
selecting the title bar and dragging it to a different area on the screen.
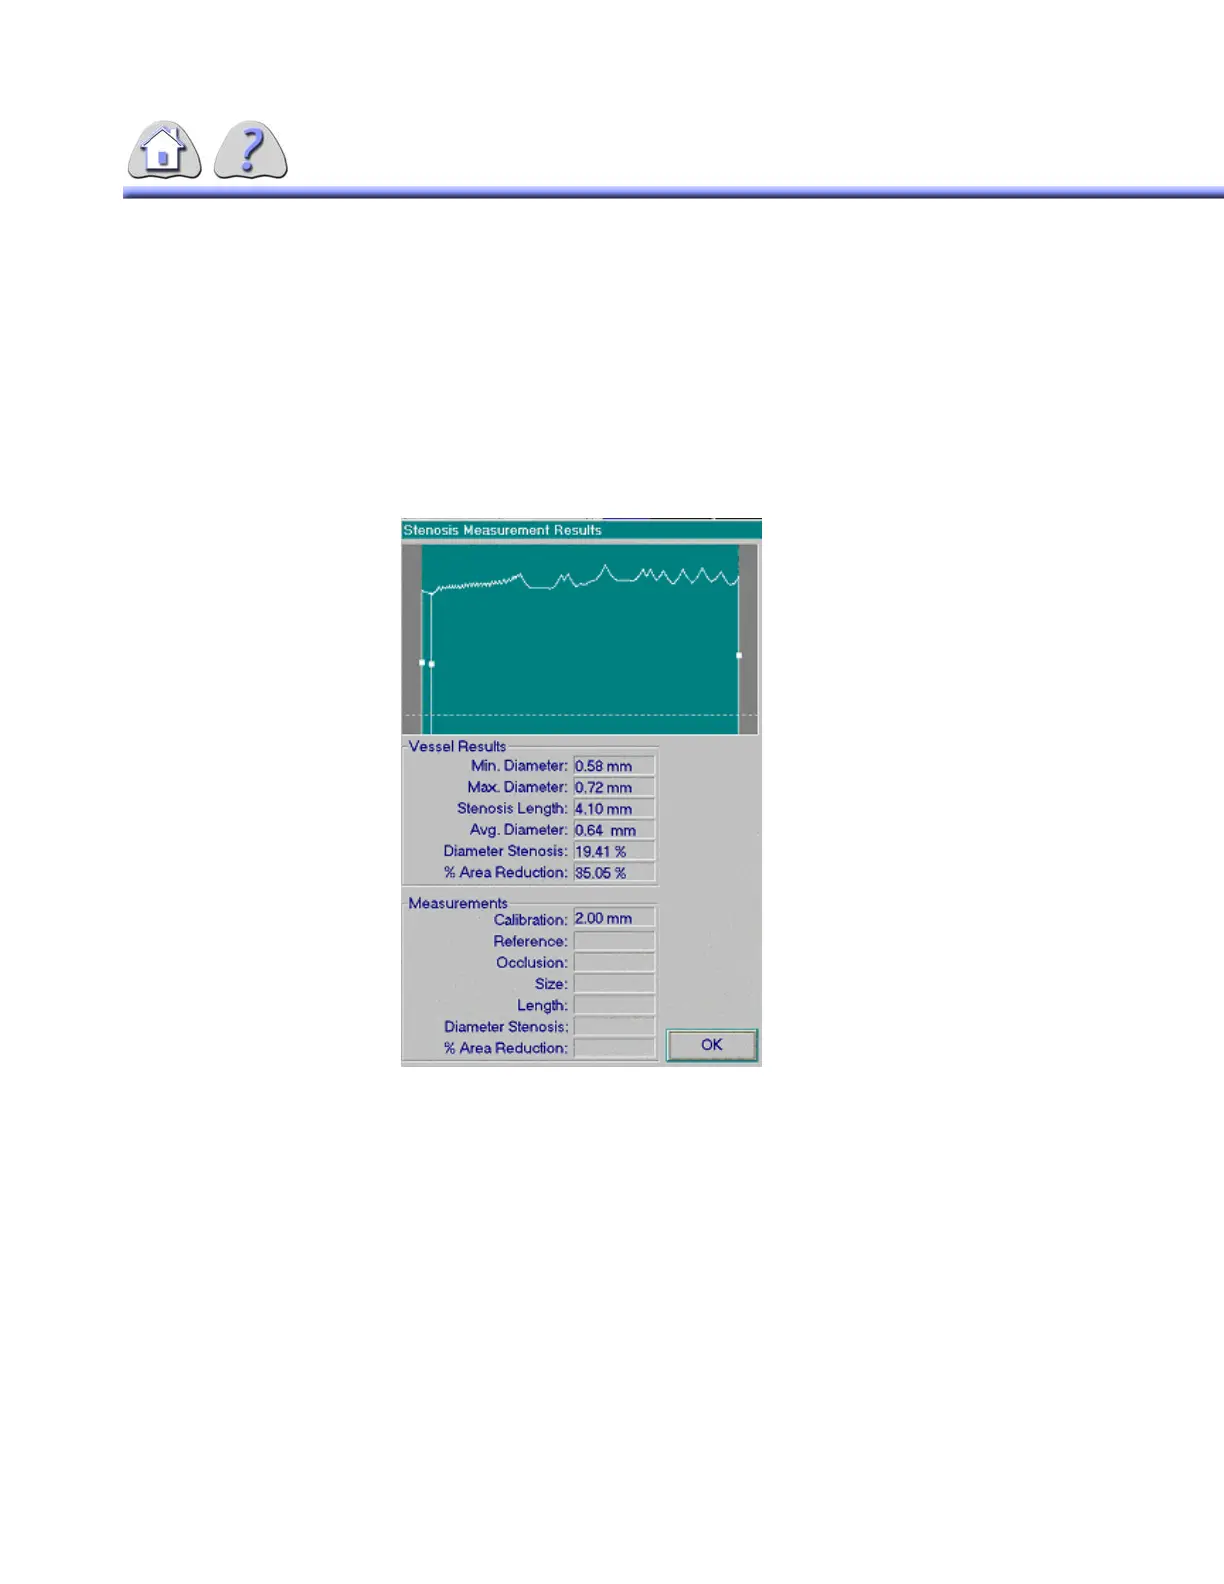
ILLUSTRATION 6-22
RESULTS SCREEN
The Vessel Diameter graph represents the distance between the vessel edges. This is only available if the Manual
Boundary process was performed.
Two of the three vertical lines represent the edges of the vessel, and the third indicates the minimum width within
the traced area of the vessel. All three lines are adjustable. You will notice that as the minimum distance line is
moved, the stenosis indicator shown on the image is moved accordingly, and the data within this screen is recalcu-
lated.
Vessel Results: These measurements are based on the vessel edge traces
entered during the Manual Boundary procedure.
FOR TRAINING PURPOSES ONLY!
NOTE: Once downloaded, this document is UNCONTROLLED, and therefore may not be the latest revision. Always confirm revision status against a validated source (ie CDL).