6.3 Evolution Workstation Status View
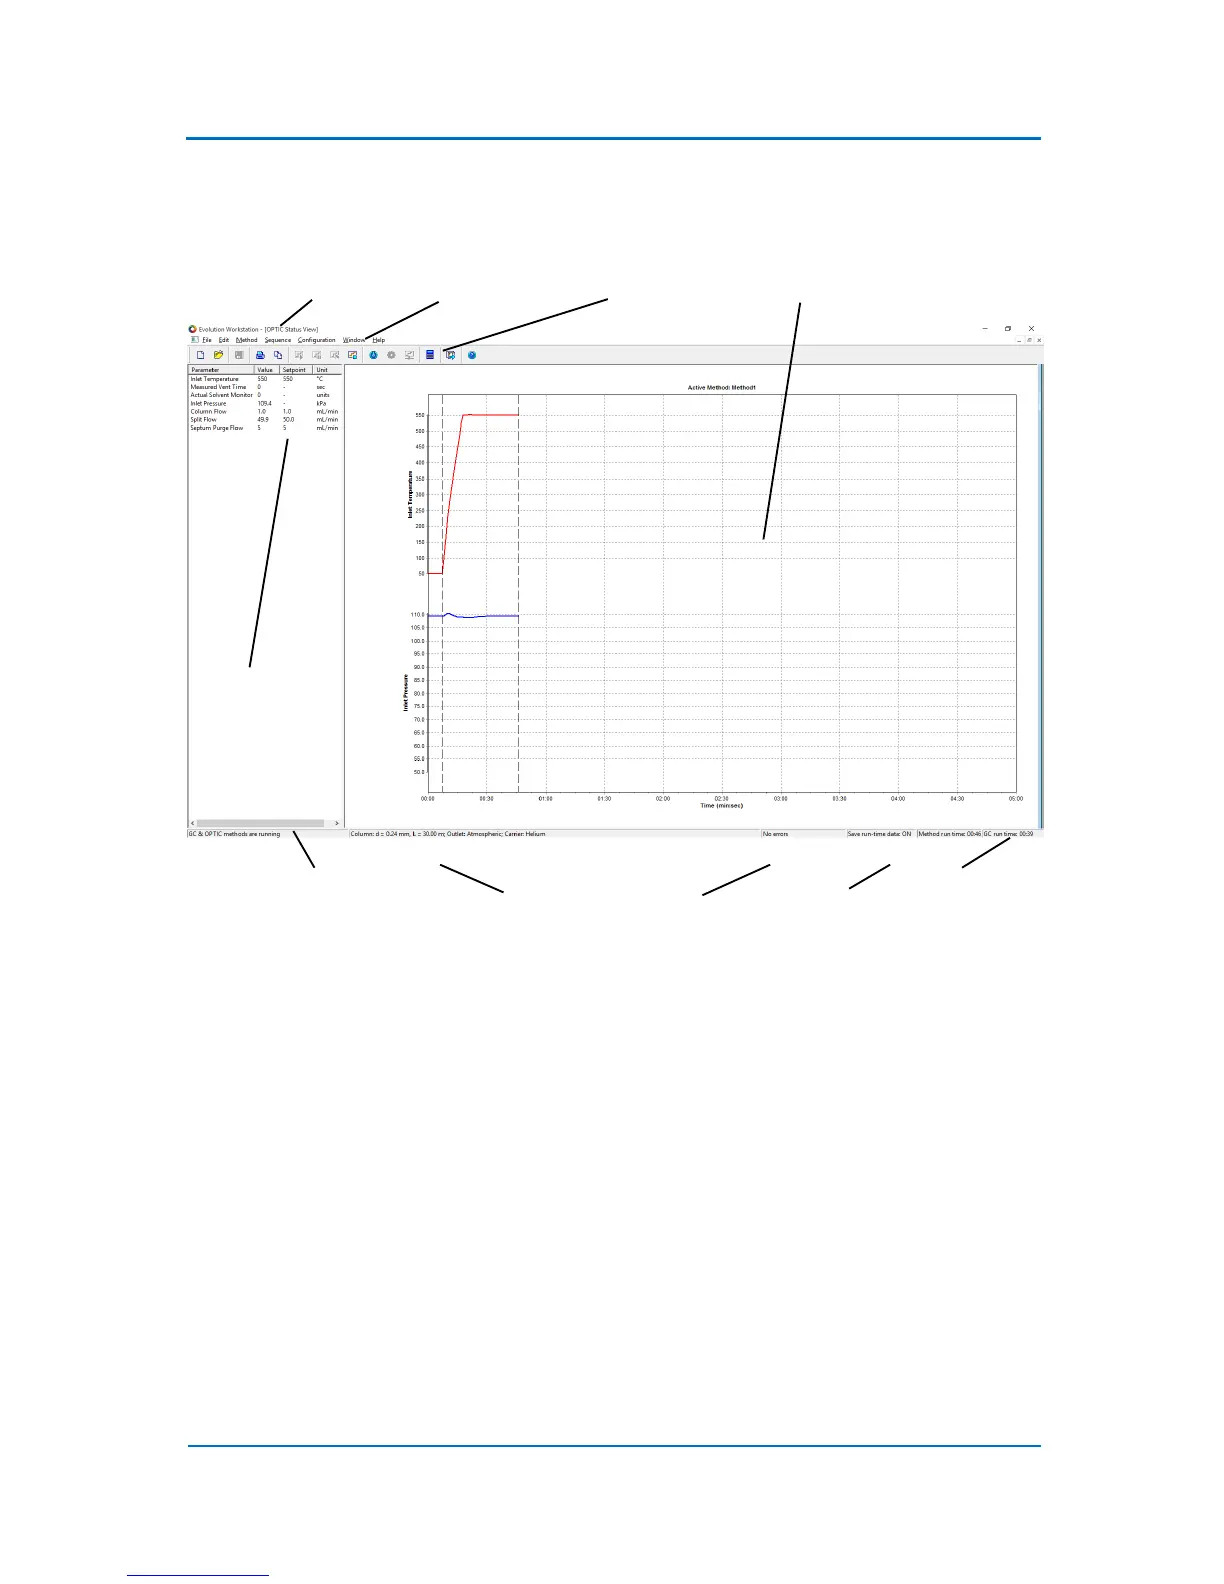
An example of the Evolution Workstation Status View is shown in Fig. 6.1 below.
Figure 6.1 Example of EW Status Window
Left side of the window displays actual values and set points for a number of system parameters.
Right side of the window displays the run time graphs for the parameters listed in the status
parameter list on the left. The status pane at the bottom of the window displays status information
of the system as well as information about the error state, the method and GC run times. It also
shows whether the “Save Run-Time Data” option is enabled or disabled.
Note, that the run time parameters are displayed in the real time without any filtering. The only
limiting factor is the precision with which the data are represented. Due to this limitation the curves
can sometimes show steps, especially if the displayed parameter range is small. Also in this case, the
displayed parameter irregularities are still within the technical specifications of the instrument.
Run time data can be saved on the hard drive. It can be enabled via Configuration/Save Run-Time
Data menu option. The data are save into the corresponding method directory.