GSI TympStar Pro User Manual
D-0129427 Rev. B Page 42 of 162
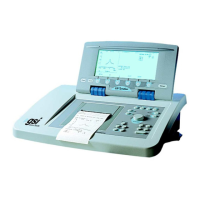
Test Type Information
Under the title bar, test specific information will be displayed. The graphical test
information is displayed on the left side of the screen. On the right side of the screen, the
probe status indicator, admittance, and pressure meters will be displayed along with the
result information for the test. The details on the test type information are described as
part of the individual test type displays.
Test Tabs
The test tabs appear on the left side of the data graph. For each new test, a tab is created,
or you may create a new tab by pressing the + tab. You may collect multiple tests for the
same test type and may select the specific tab to review the data. For tests that have the
possibility of different probe tones, the probe tone is indicated in the test tab. A check
mark on the tab indicates that the test has been “marked.” The marked tab indicates the
test that will be exported to GSI Suite or printed directly from the device.
When you are reviewing data, there are some parameters that may be changed in analysis.
You may change the baseline view or the immittance component on the test menu. In the
settings menu, you may change the display options. These parameter changes will be
applied to the existing data that is being reviewed. Other parameters on the test menu
such as the probe tone frequency or sweep rate will create a new test tab ready to begin
collection. When you are reviewing existing data and you press start to begin a new test, a
new tab will be created and the parameters for the test will be those defined in the current
protocol. If you wish to collect data and use parameters that are not part of the current
protocol, you should select the + tab and change the parameters then press the start
button.
Test Menu
This menu is located at the bottom of the display. The menu is specific to the test type
selected.
Time and Date
The date and time are displayed in the bottom right corner of the screen. Using the
Configuration Application, the Time may be configured in a 12- or 24-hour format and the
Date may be configured in any order (dd/mm/yyyy, etc.). It is also possible to set the time
and date on the configuration screen of the instrument.
NOTE: The time does not change automatically for daylight savings time. The operator
must manually change the time using the configure button on the front panel of the
instrument or the configuration application. However, if the device is attached to a PC,
then the GSI Instrument Services software can automatically update the device from the
PC.