GSI TympStar Pro User Manual
D-0129427 Rev. B Page 51 of 162
Up to three tympanograms may be displayed per test. When running multiple
tympanograms, the direction of the pressure sweep must alternate between sweeps (i.e. if
the first sweep goes from positive pressure to negative pressure the second sweep goes
from negative pressure to positive pressure). The peak of the tympanogram may be
indicated by the arrow and line if the Peak Indicator is selected in Settings. The peak may
be manually set by the user using the Zoom function.
Probe Status Indicator
The probe status indicator indicates the
state of the probe and displays messages
regarding the current test. On the left side of the indicator, the two circles will be colored
to match the LED lights on the probe box. The probe may be in the following states:
Hold – ready to continue test
Leak (or possible internal error on the device)
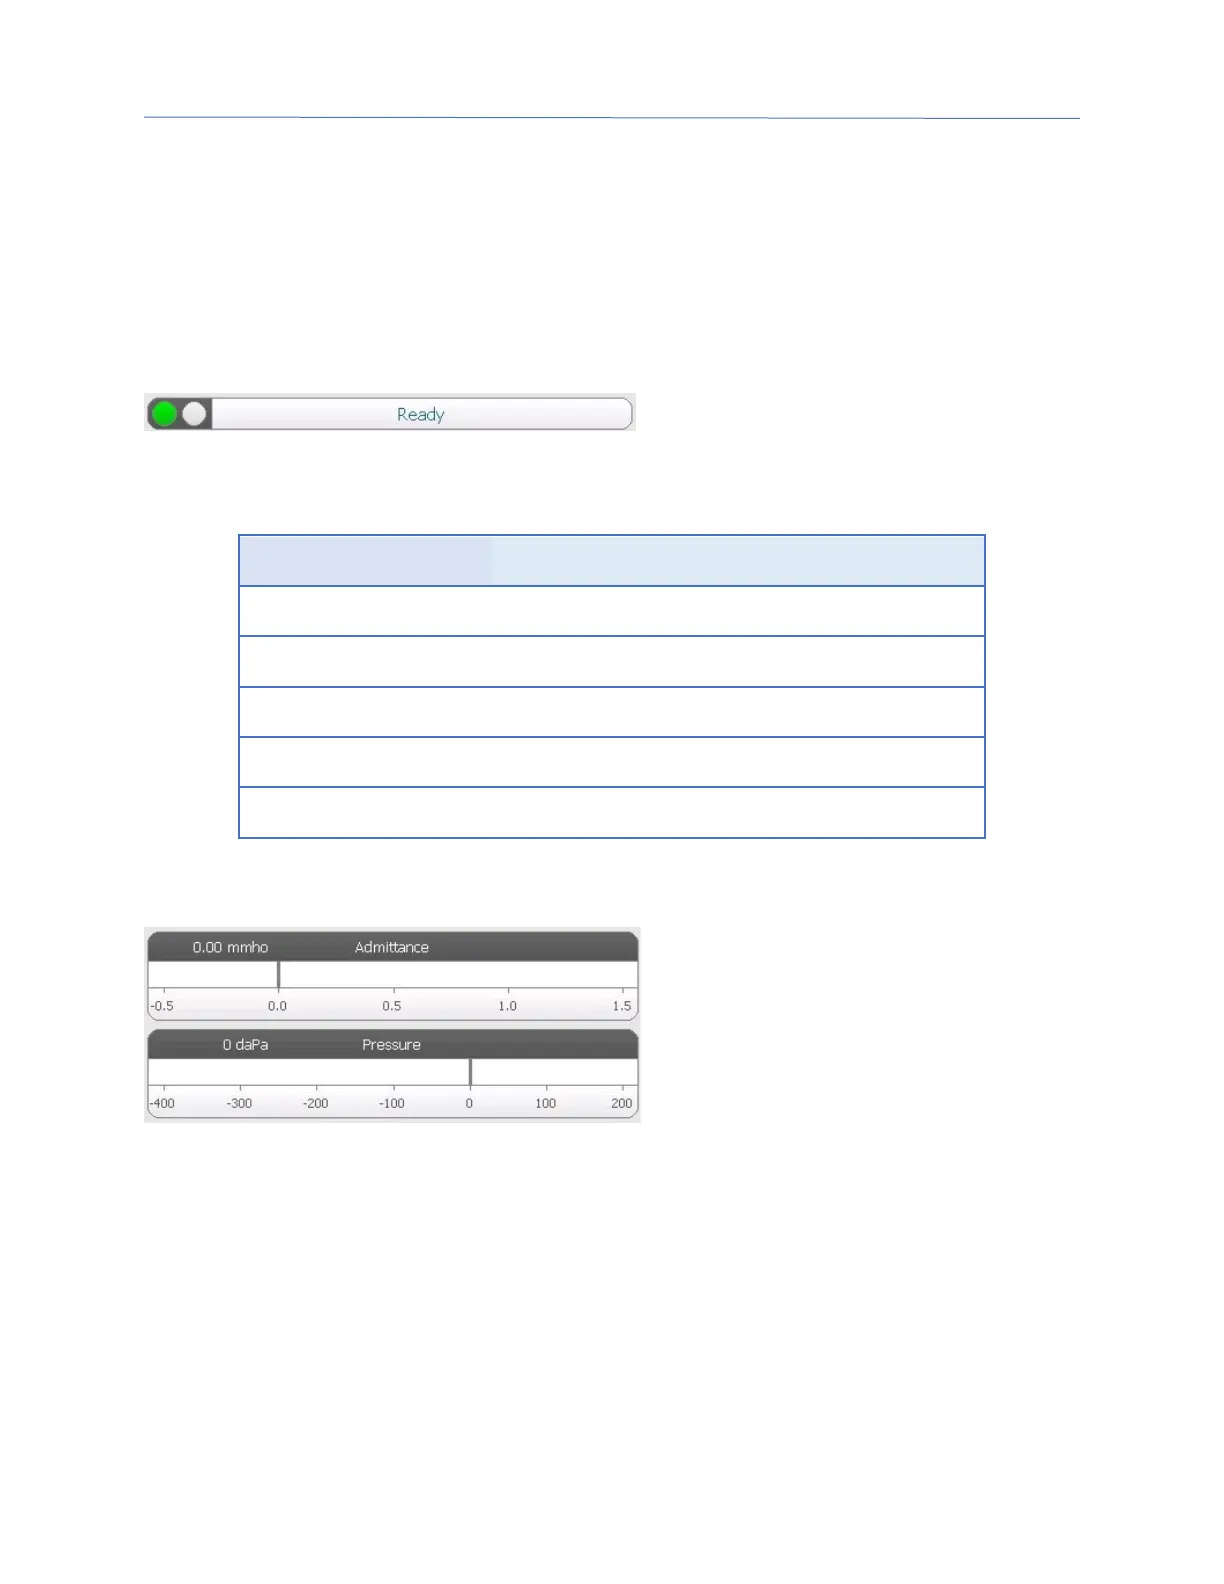
Admittance and Pressure Meters
The admittance meter displays the real
time admittance as it is being recorded
from the probe in the ear canal. The
units are millimhos (mmho). The current
value is displayed at the top left of the
meter.
The pressure meter displays the real time pressure as it is being recorded from the probe
in the ear canal. The units are decapascals (daPa). The current value is displayed at the top
left of the meter. The pressure range is controlled from the pressure range parameter for
the test.
Manual
Pressing the Manual button initiates a tympanogram collection where the pressure knob is
used to manually increase or decrease the pressure. When performing manual
measurements, multiple tympanograms are displayed until the Stop key is pressed. The
graphs from the last three measurements are saved and presented in the table of results.
 Loading...