GSI TympStar Pro User Manual
D-0129427 Rev. B Page 94 of 162
Multi-Hz Test Results
Tab 1-Tymp 226 Hz
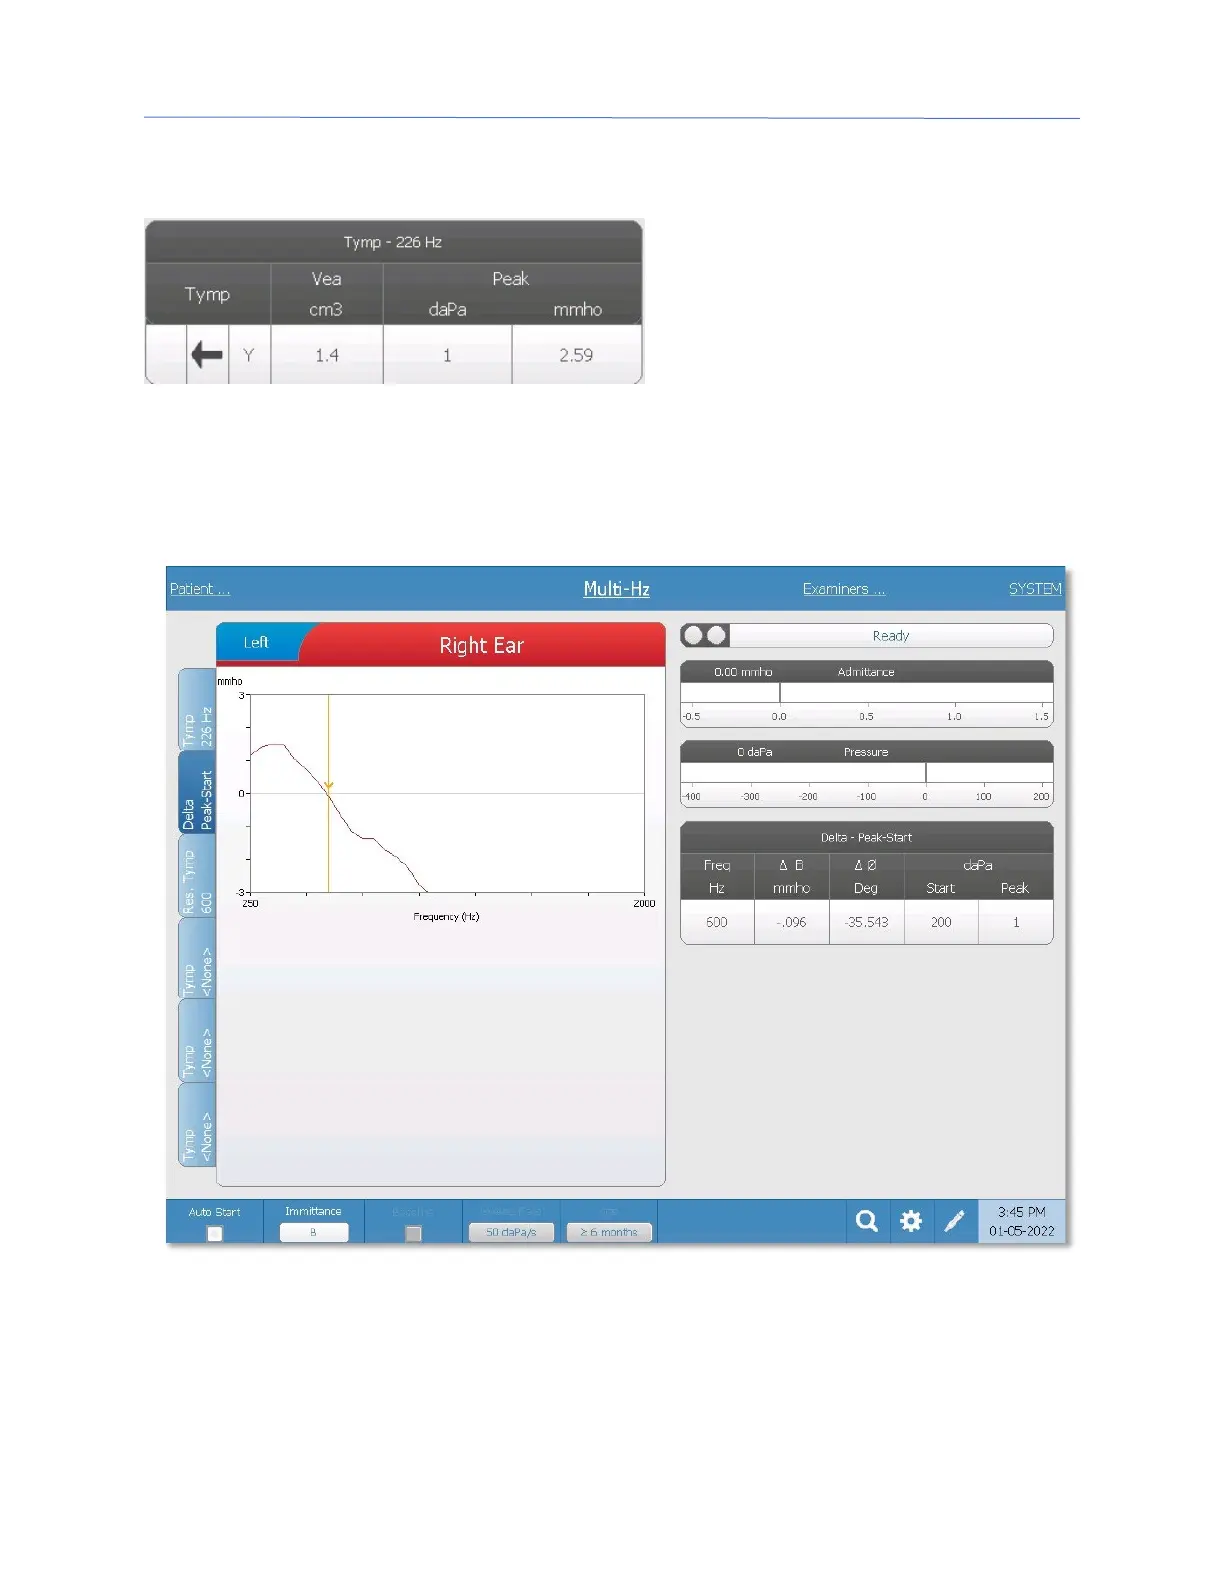
The 226 Hz tympanogram displays on
the graph and the numerical results
display in a table on the lower right side
of the display. The Tymp column
displays the direction of the pressure
sweep and the component that is being
shown on the tympanogram. The Vea column displays the acoustic equivalent volume (in
cm
3
). The Peak column displays the pressure (daPa) and admittance (mmho) value of the
indicated peak of the tympanogram.
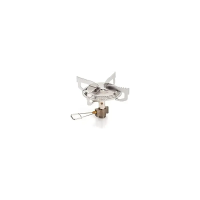
Tab 2- Delta Peak-Start
The graph displays the difference between the immittance component B at the Start
pressure (+200 daPa, default) and Peak pressure as a function of frequency (
ΔB). The
resonance frequency of the ear is automatically identified by the cursor on the graphic
display where ΔB crosses 0 mmhos. Resonance of the ear is reached when stiffness and
mass components are equal in magnitude.


 To Next Page