GDS-2000A Series User Manual
70
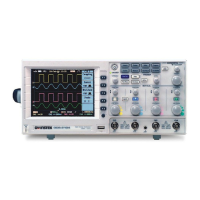
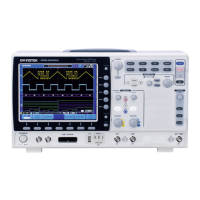
The Time/Division rate is displayed to the left of the H
icon at the bottom of the screen.
The display bar indicates how much
of the waveform is displayed on the
screen at any given time. Changes to
timebase will be reflected on the
display bar.
In the Stop mode, the waveform size
changes according to the scale.
The Sample rate changes according to the
time/division and record length. See page 109.
 Loading...