7.2 Displaying Trends
99
Chapter 7 Monitoring Fluctuations in Measured Val-
7
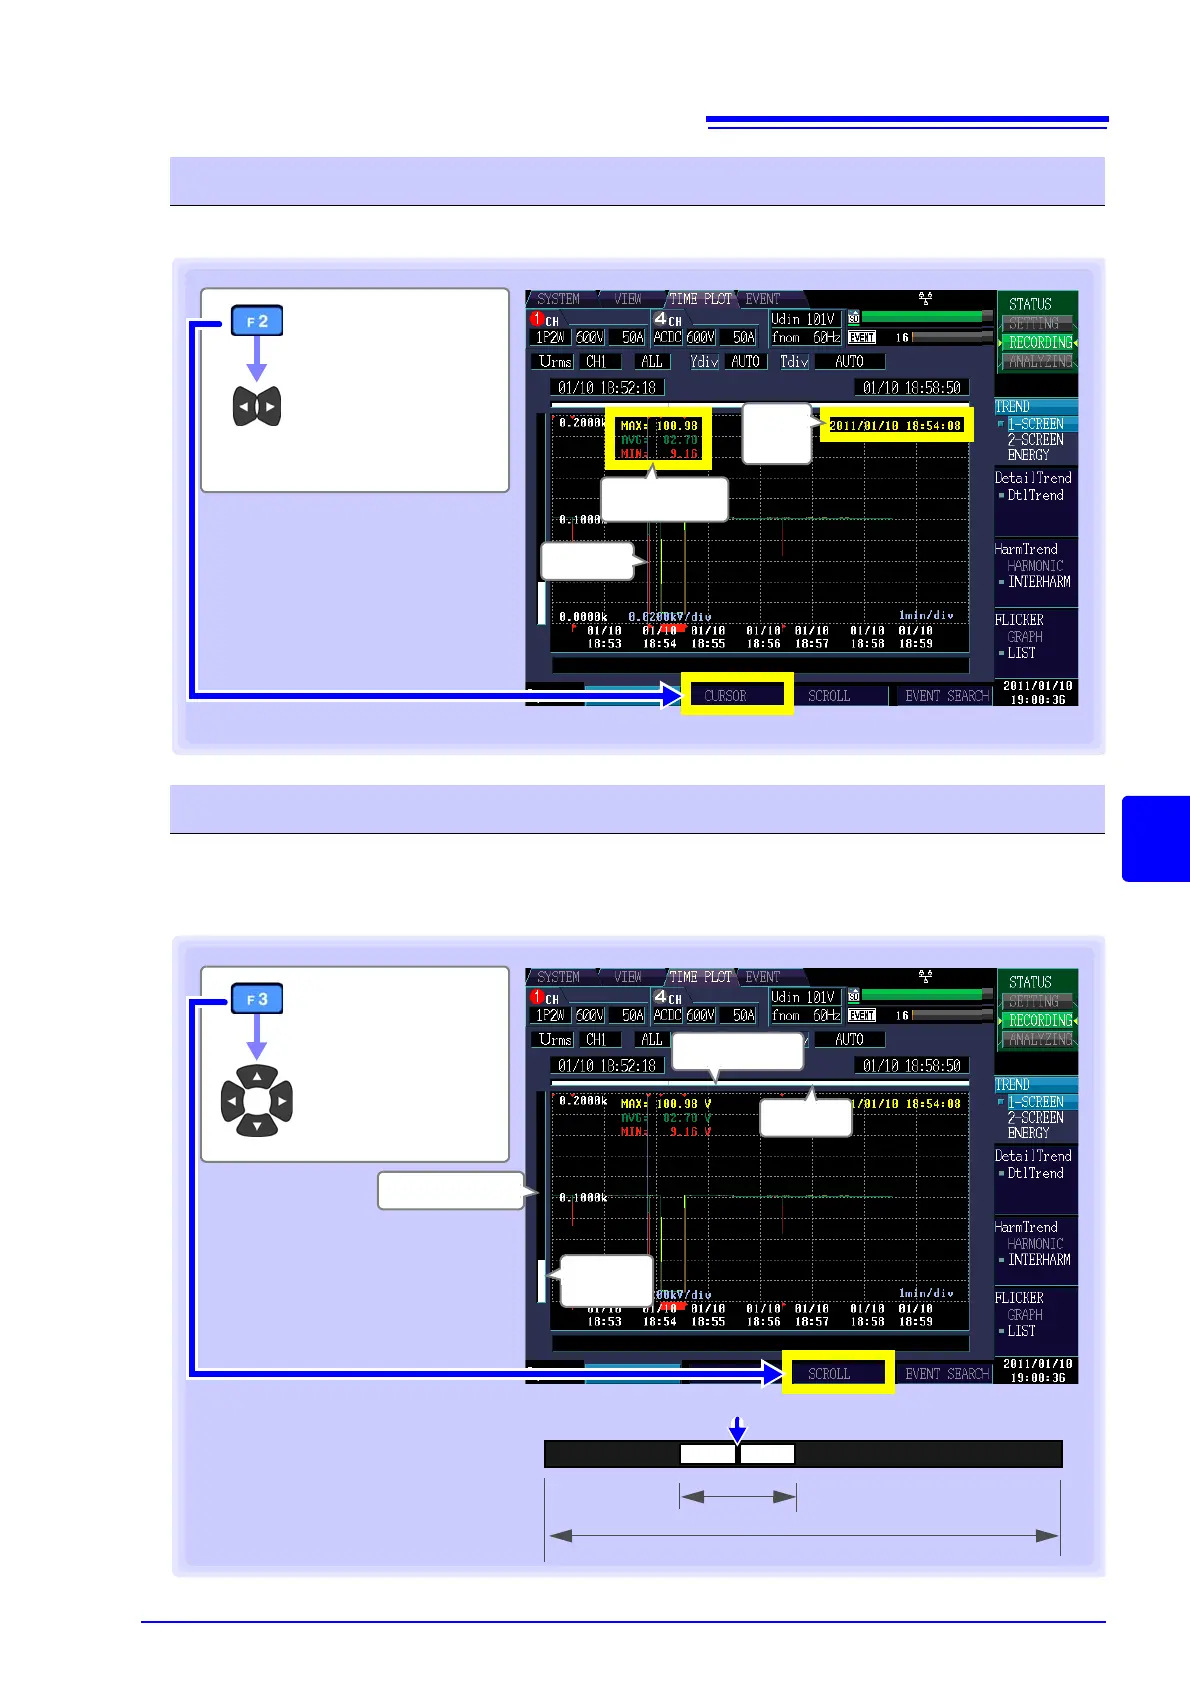
You can read the value above the cursor and the time on the time series graph
During recording, the X- and Y-axis are automatically scaled so that the full time series graph fits on the
screen. Once recording has stopped and the X- and Y-axis scale has been changed so that the waveforms do
not fit on the screen, you can scroll through the time series graph by moving left, right, up, and down.
Viewing the value and time over the cursor (Cursor measurements)
[CURSOR]
Move the vertical
cursor left and
right to read the
display value.
Cursor
Cursor
time
Cursor value
When using one or two screens:
MAX (maximum value),
AVG (average value),
MIN (minimum value)
When using the [ENERGY] screen:
WP+ (consumption), WP- (regen-
eration), LAG (lag), LEAD (lead)
Scrolling through display data
[SCROLL]
Scroll through the
graph
Scroll bar
Scroll bar
Display
scope
Display scope
• The display scope on the scroll bar (shown in
white) illustrates which range of all measurement
data is being shown on the screen.
• The cursor on the scroll bar shows where the cur-
sor is located relative to all measurement data.
Scroll bar
Display scope
All measurement data
Cursor position

 Loading...


