7.1 Using the [TIMEPLOT] Screen
93
Chapter 7 Monitoring Fluctuations in Measured Val-
7
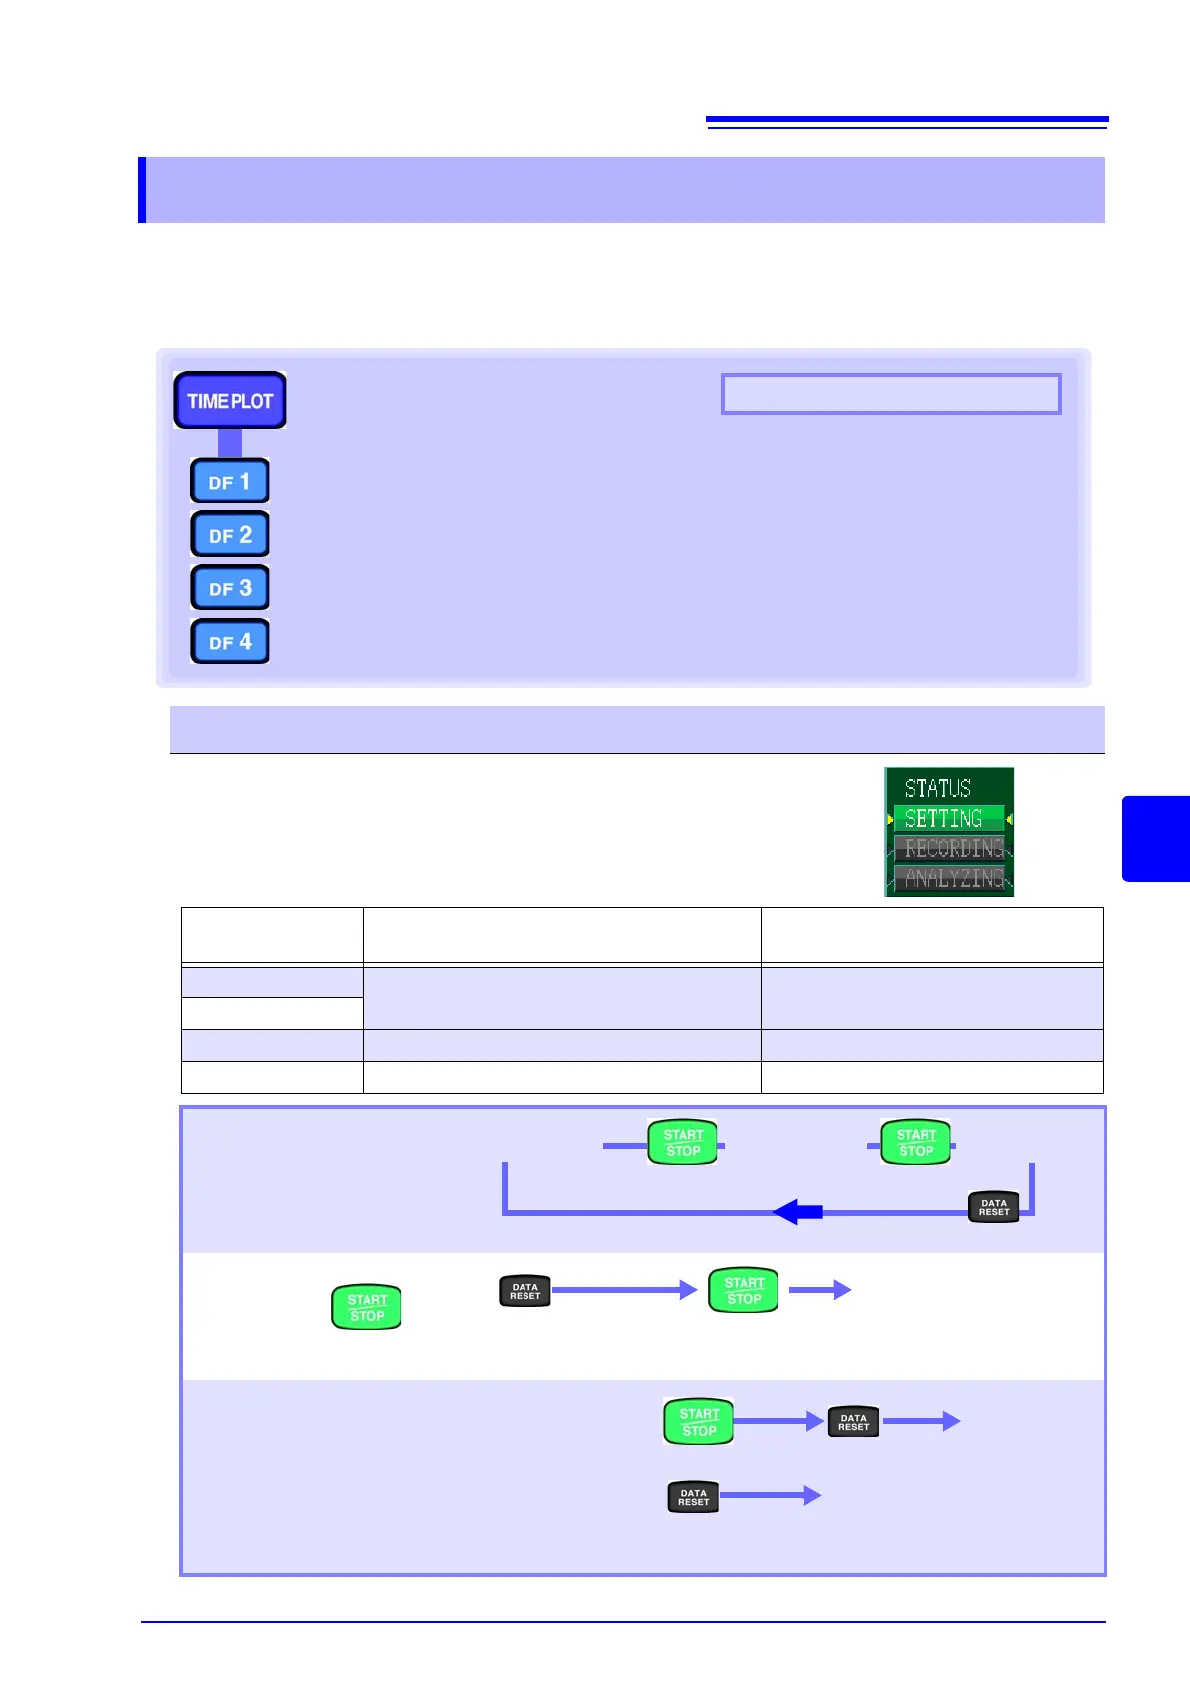
The TIME PLOT screen is composed of a number of screens that correspond to the DF1 to DF4
(DF: display function) keys.
When you press a DF key, the screen corresponding to that key appears.When there are multiple
screens, the screen display will change every time the same DF key is pressed.
When recording starts, the time series graph is displayed on the TIME PLOT screen.
The Y-axis and X-axis are automatically scaled so that all the time series
graphs are displayed on the screen.
When recording is stopped, updating of the time series graph display stops.
7.1 Using the [TIMEPLOT] Screen
TIME PLOT screen selector
TREND
See: "7.2 Displaying Trends" (p.94)
DetailTrend
See: "7.3 Displaying detailed trends" (p.101)
HarmTrend
See: "7.4 Displaying Harmonic Trends" (p.107)
FLICKER
See: "7.5 Displaying Flicker Values in Graph and List Form" (p.111)
Switching screen display
About screen configuration (p.23)
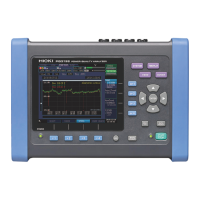
The screen shown varies with the instrument's internal operating state.
Internal
operation status
Display Display update
[SETTING]
No time series graph display data. -----------
[WAITING]
[RECORDING] The time series graph display is updated. Every set TIMEPOT interval
[ANALYZING] Updating of the time series graph display stops. -----------
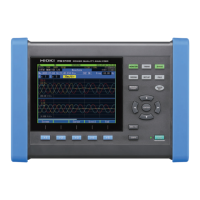
Relationship between
instrument status and key
operation
When you want to start
recording, but does
not work because the instru-
ment is in
[ANALYZING] mode
When you want to change
settings in
[RECORDING] or
[ANALYZING] mode
In both cases, all displayed measurement data will be deleted.
[SETTING]
[RECORDING] [ANALYZING]
Start
recording
Stop
recording
Revert to [SETTING] mode
Set
Return to [SETTING]
mode from
[ANALYZING] mode
[RECORDING]
Start
recording
[SETTING]
In [RECORDING]
mode:
Stop recording Revert to [SETTING] mode
[SETTING]
In [ANALYZING]
mode:
Revert to [SETTING] mode