92
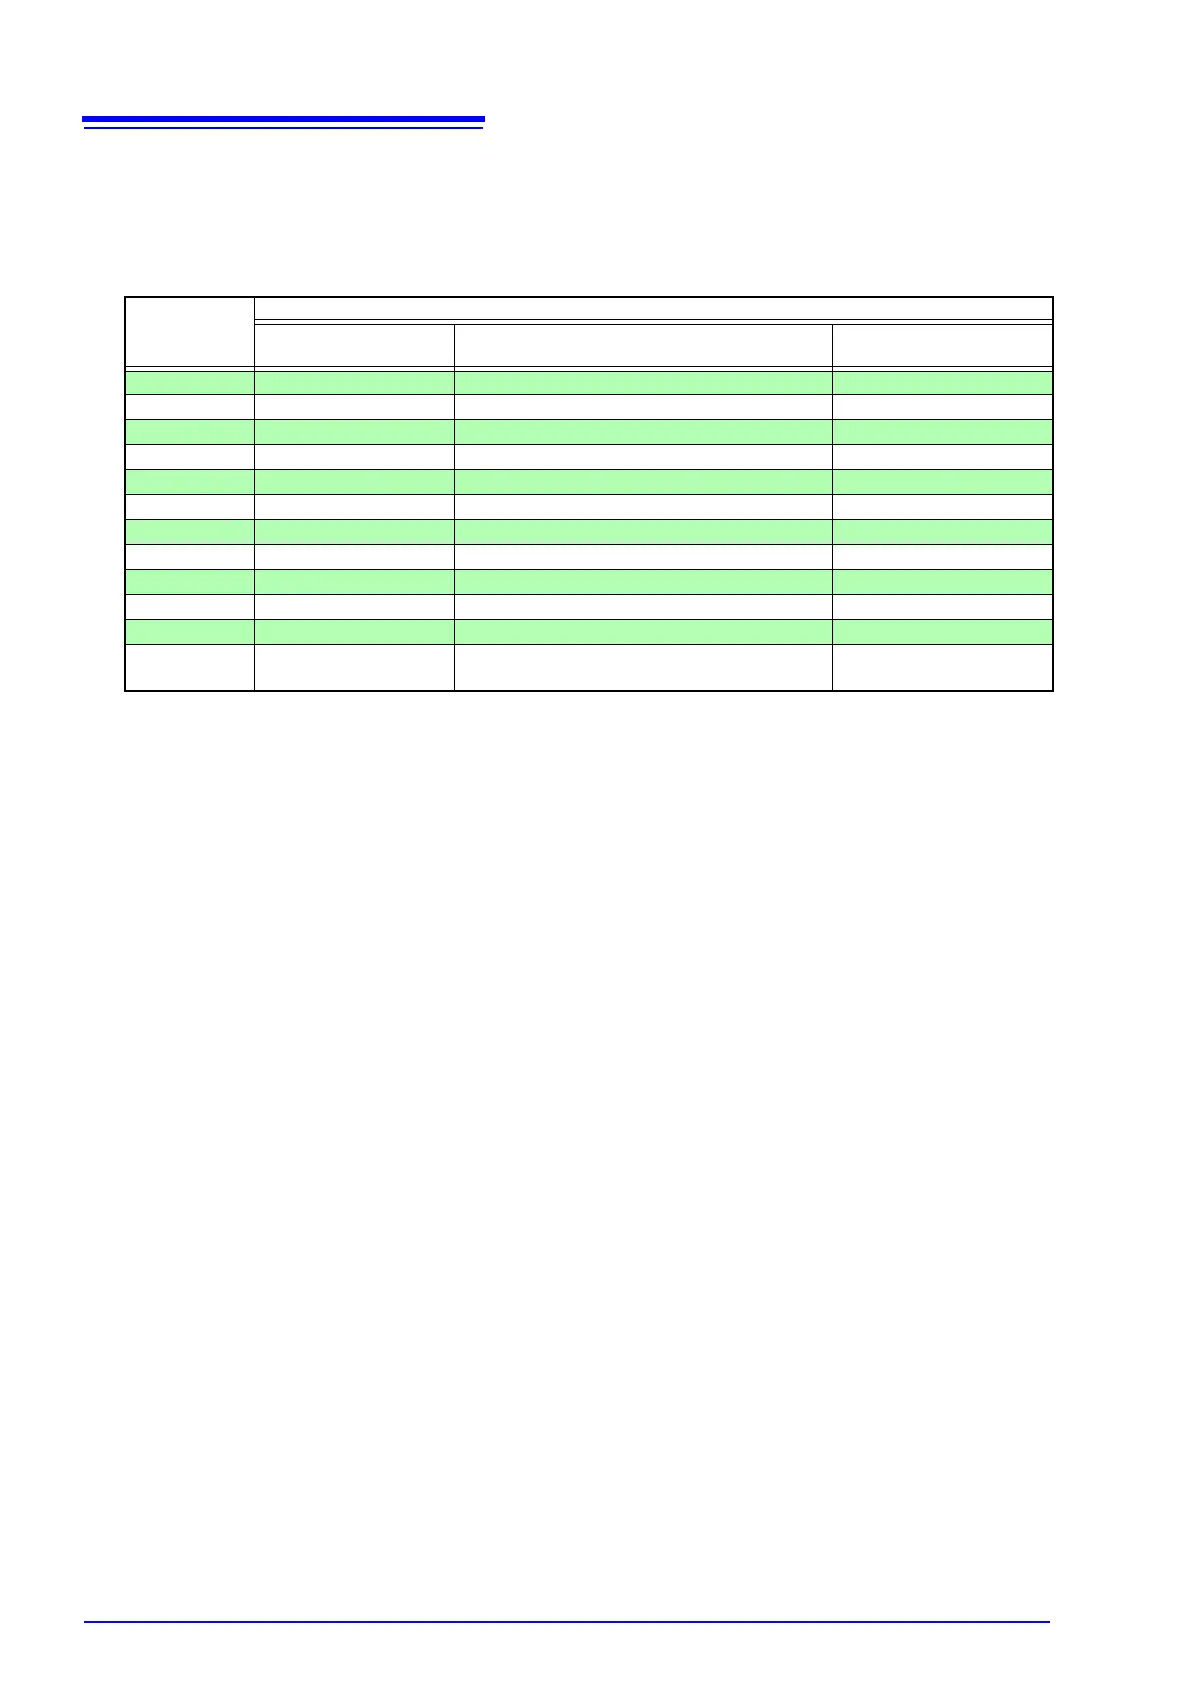
Display of trend data, detailed trend data, and harmonic trend data on the instrument is subject to certain
constraints. Updating of the displayed time series graph will stop when the times listed in the following
table are exceeded. Data will continue to be recorded to the SD memory card (see recording times
(p.63)) even if updating of the displayed time series graph stops.
[TIMEPLOT] screen maximum display times
TIME PLOT
Interval
Recording Items setting
ALL DATA
(Saves all data)
P&Harm
(Saves RMS values and harmonics)
Power
(Saves RMS values only)
1sec 7 min. 52 sec. 15 min. 44 sec. 2 hours 37 min. 20 sec.
3sec 23 min. 36 sec. 47 min. 12 sec. 7 hours 52 min.
15sec 1 hour 58 min. 3 hours 56 min. 1 day 15 hours 20 min.
30sec 3 hours 56 min. 7 hours 52 min. 3 days 6 hours 40 min.
1min 7 hours 58 min. 15 hours 44 min. 6 days 13 hours 20 min.
5min 1 day 15 hours 20 min. 3 days 6 hours 40 min. 32 days 18 hours 40 min.
10min 3 days 6 hours 40 min. 6 days 13 hours 20 min. 35 days
15min 4 days 22 hours 9 days 20 hours 35 days
30min 9 days 20 hours 19 days 16 hours 35 days
1hour 19 days 16 hours 35 days 35 days
2hours 35 days 35 days 35 days
150/180 wave
(Approx. 3 sec)
23 min. 36 sec. 47 min. 12 sec. 7 hours 52 min.