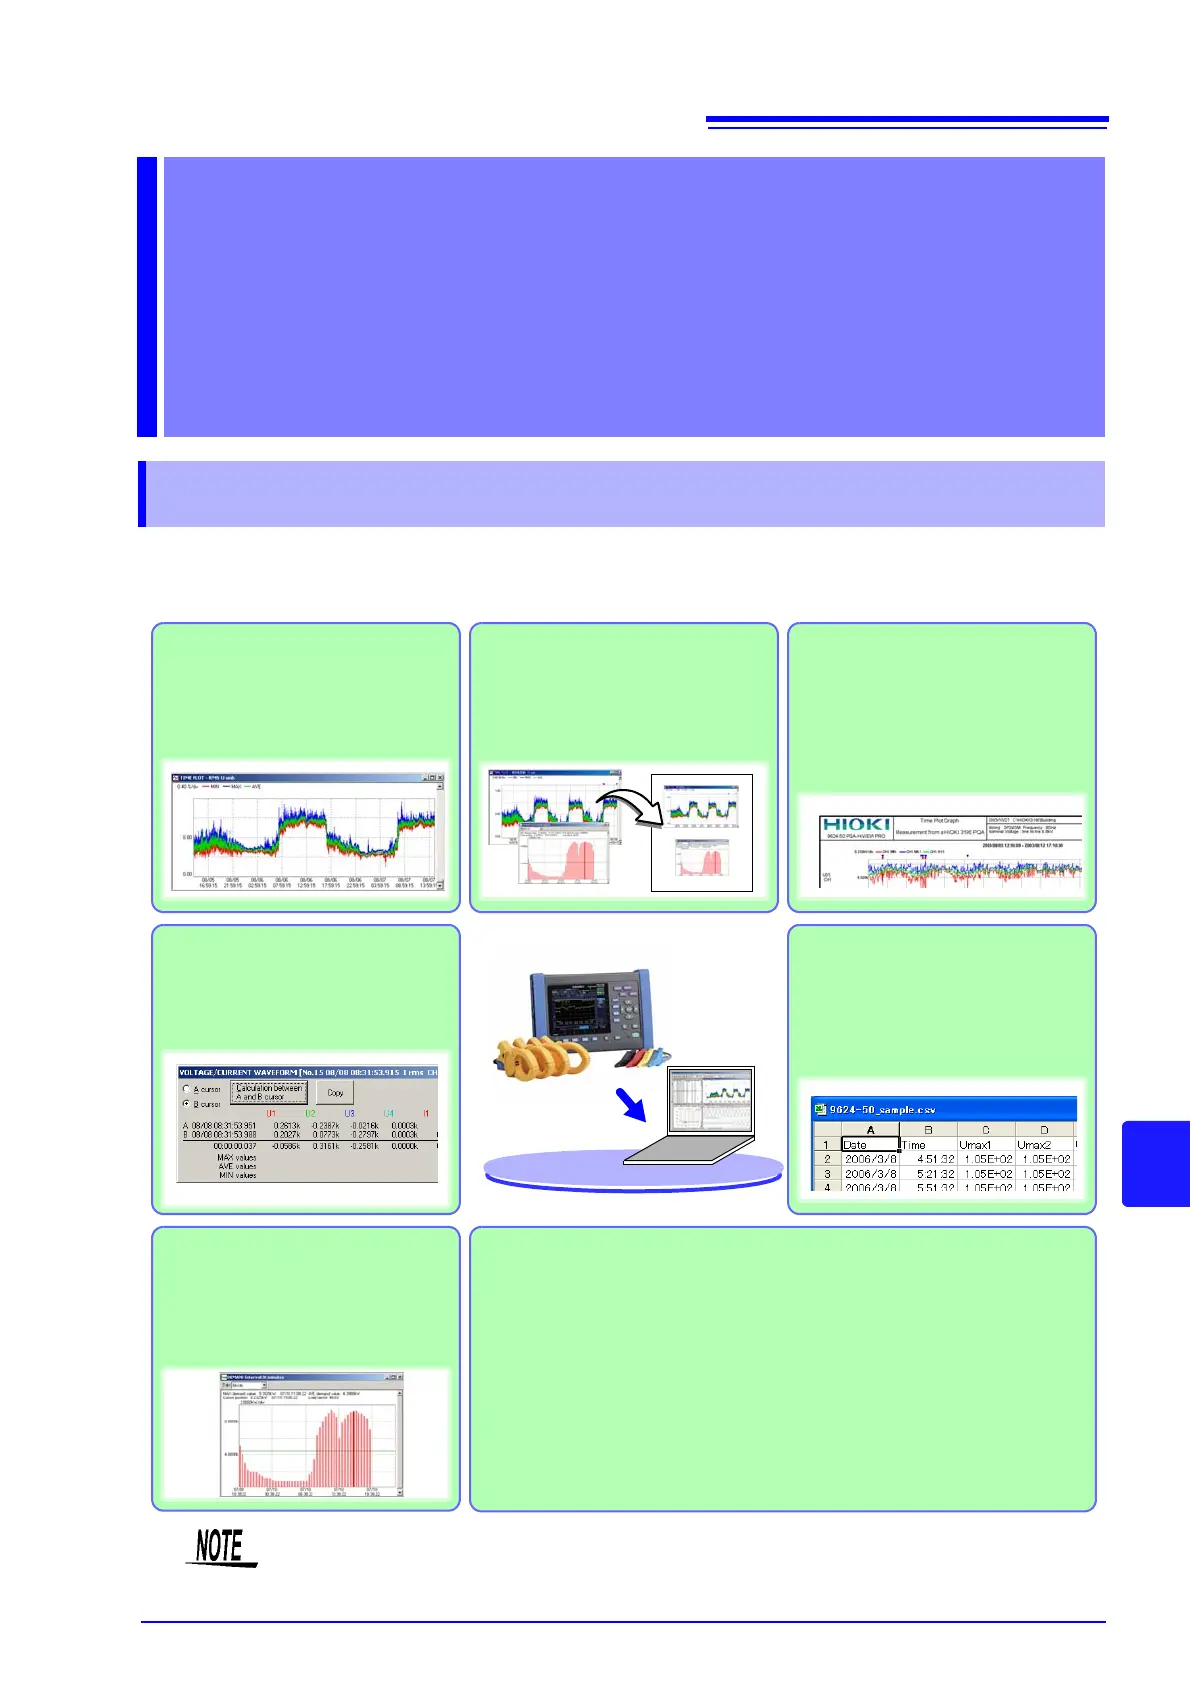
Download measurement data
from the PW3198
Connect the Hioki PW3198 to a comput-
er via LAN to download data from its in-
ternal memory and data files from the
PW3198's SD memory card.
Display and Analyze Measure-
ment Data
Analyze measurement data in greater
detail using the same display as the
PW3198. You can also display and com-
pare multiple graphs.
Print Displayed Windows and
Copying
Print and copy displayed windows for
use in other applications.
Convert Measurement Data to
CSV Format
Convert any span of measurement data
to CSV format. Load converted files into
computer spreadsheet programs.
Display Measurement and Calcula-
tion Values (Maximum, Minimum
and Average)
Use the A/B cursors to view maximum,
minimum and average values within any
time span.
Display measurement data in
EN50160 mode
Judge anomalies according to
the ITIC (CBEMA) Curve*
* Commonly used in the USA, the ITIC
Curve is a standard for evaluating volt-
age anomalies by specifying a range of
acceptable tolerance. A "User-Defined
Curve" can be optionally defined for
voltage anomaly evaluation.
Generate Measurement Data
Reports
Print any measurement as a report.
You can also save it as a rich text format
file, and use it in other applications.
Calculate Demand and Integral
Power Hioki PW3198
From the measurement data, calculate
maximum and average demand values,
and integral power.
(for a fee) to users of versions prior to 2.00.