Appendix 4 Recording TIMEPLOT Data and Event Waveforms
A
15
Appendix
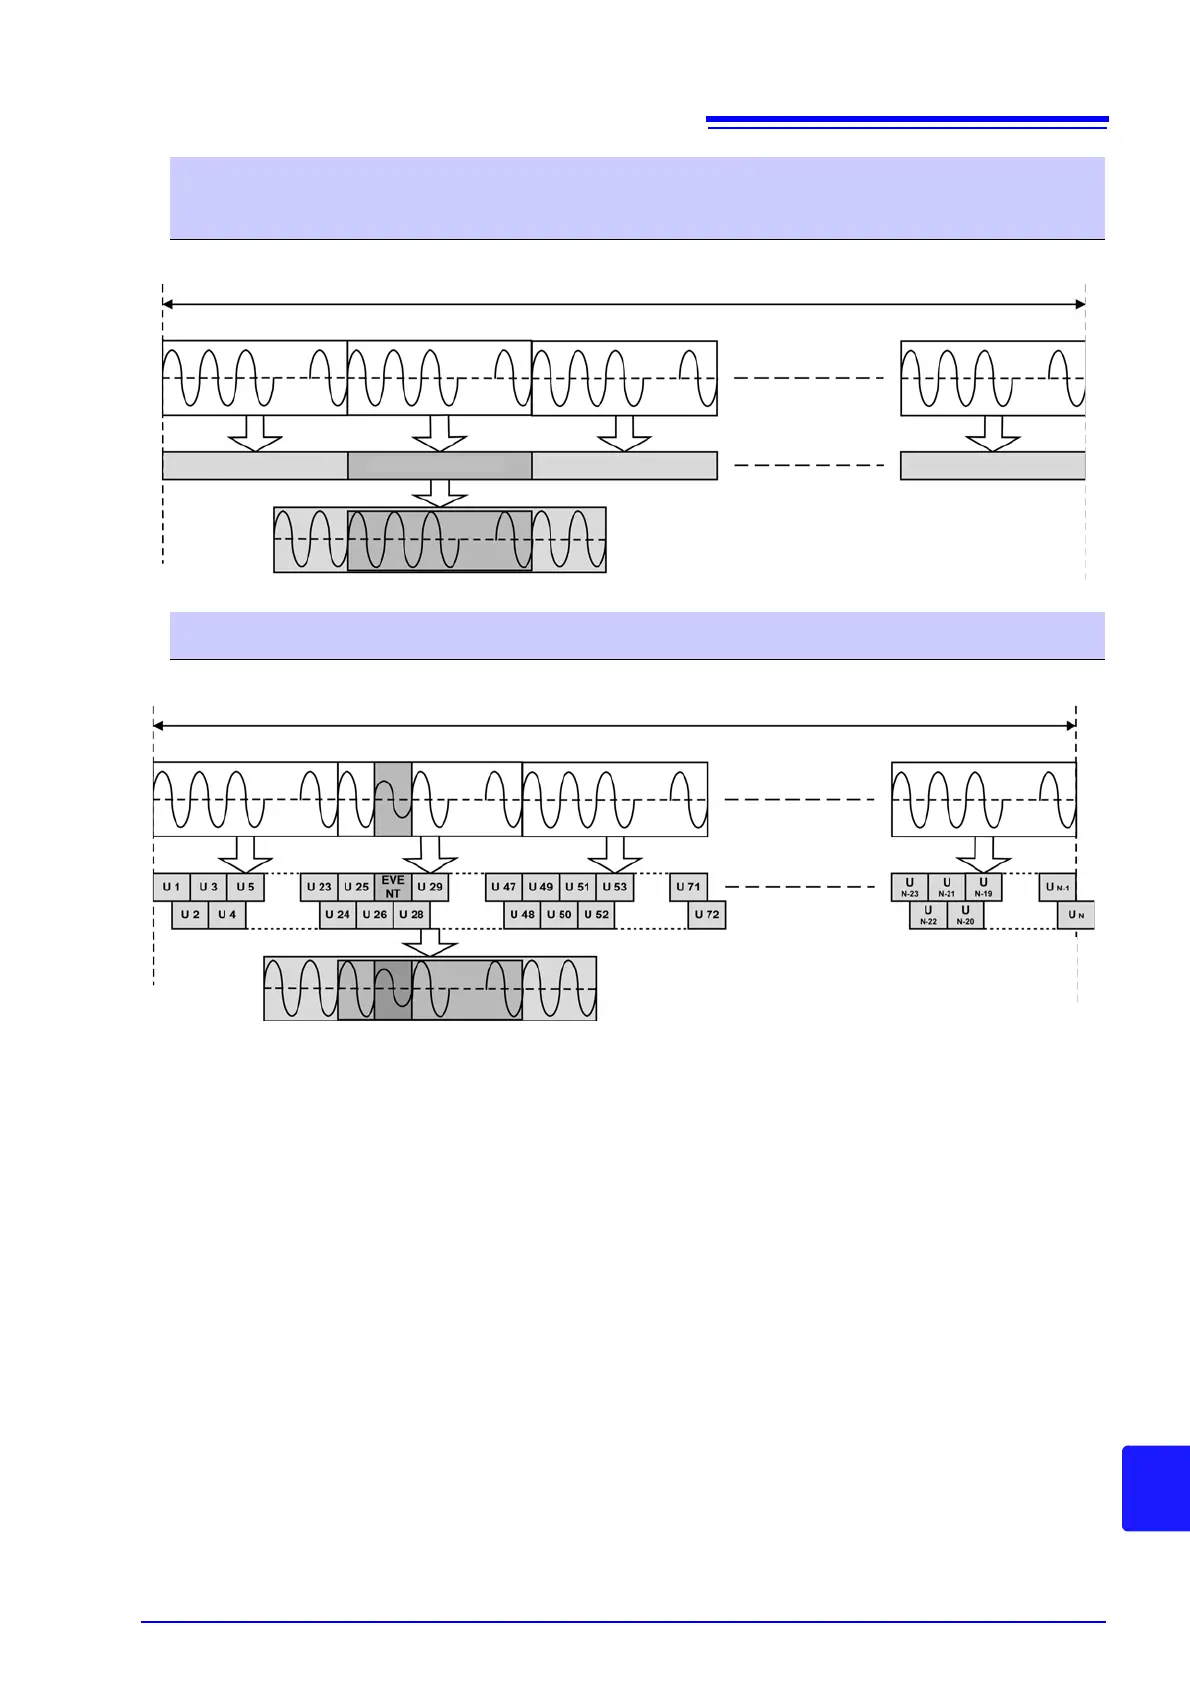
Event Waveform Recording Method
Generating events using approx. 200 ms aggregation measured values
RMS calculation RMS calculation RMS calculationEVENT occur
Event waveform record-
ing period
50 Hz: 14 cycles
60 Hz: 16 cycles
The result of adding the two waveforms
prior to and the two waveforms after the
approx. 200 ms aggregation is displayed
as the event waveform.
Approx. 200 ms aggregation (50 Hz: 10 cycles, 60 Hz: 12 cycles)
SYSTEM_DF1 [RECORD] TIME PLOT Interval (setting period)
Generating events using one- or half-wave measured values
SYSTEM_DF1 [RECORD] TIME PLOT Interval (setting period)
Approx. 200 ms aggregation (50 Hz: 10 cycles, 60 Hz: 12 cycles)
Event waveform record-
ing period
50 Hz: 14 cycles
60 Hz: 16 cycles
The result of adding the two waveforms
prior to and the two waveforms after the
approx. 200 ms aggregation is displayed
as the event waveform.